Quantcast
Channel: ggplot2 – DataScience+
Viewing all 47 articles
Browse latest View live

ggplot2 themes examples

$
0
0

This short post is exactly what it seems: a showcase of all ggplot2 themes available within the ggplot2 package. I was doing such a list for myself (you know that feeling …”how would it look like with this theme? let’s try this one…”) and at the end I thought it could have be useful for my readers. At least this post will save you the time of trying all different themes just to have a sense of how they look like.
Enjoy!

theme_bw()

theme_bw

theme_classic()

theme_classic

theme_dark()

theme_dark

theme_gray()

theme_gray

theme_grey()

theme_grey

theme_light()

theme_light

theme_linedraw()

theme_linedraw

theme_minimal()

theme_minimal

Bonus Track: The Code

Since copy and pasting and right-clicking 9 times to produce all the plots was definitely not acceptable, I wrote a small function to dynamically create and save a png file with different name and content.

library(dplyr) #data manipulation
library(ggplot2) #data visualization

create_file <- function(name){
  path % file.path() %>% png(,width=960,height=480)
}

#this is the template: change the theme (and the name argument) to produce the other plots
create_file(name = "theme_bw")
ggplot(data=diamonds, aes(carat,price ))+
  geom_point(aes(colour= color))+
  theme_bw()
dev.off()

Final notes

Inner ggplot2 structure allows for a nearly infinite number of customizations and extensions.You can have a sense of what I am talking about looking at ggplot2 extensions website or to the ggthemes package vignette by the package author Jeffrey B. Arnold.

    Related Post

    1. Map the Life Expectancy in United States with data from Wikipedia
    2. What can we learn from the statistics of the EURO 2016 – Application of factor analysis
    3. Visualizing obesity across United States by using data from Wikipedia
    4. Plotting App for ggplot2 – Part 2
    5. Mastering R plot – Part 3: Outer margins

    Visualize your Portfolio’s Performance and Generate a Nice Report with R

    $
    0
    0

    Category

    Tags

    There are few things more exciting than seeing your stocks values going up! I started investing last year in stocks and, like visualization and R lover, I couldn’t help but create some nice plots and functions to automate the process of watching it happen.

    Some of you might already know the lares package; I’ve included these following ‘stocks family’ functions for some time now but today is the day in which I’ll share with you its nice useful outputs.

    Introduction

    The overall idea of these functions is to visualize your stocks and portfolio’s performance with a just a few lines of simple code. I’ve created individual functions for each of the calculations and plots, and some other functions that gather all of them into a single list of objects for further use.

    On the other hand, the lares package is “my personal library used to automate and speed my everyday work on Analysis and Machine Learning tasks”. I am more than happy to share it with you for your personal use. Feel free to install, use, and comment on any of its code and functionalities and I’ll happy to help you with it. I have previously shared other uses of the library in other posts which might also interest you: Visualizing ML Results (binary), Visualizing ML Results (continuous) and AutoML to understand datasets.

    • NOTE 1: The following post was written by a non-economist or professional investor. I am open to your comments and technical corrections if needed. Glad to learn as always!
    • NOTE 2: I will be using the less customizable functions in this post so we can focus more on the outputs than in the coding part; but once again, feel free to use the functions and dive into the library to understand or change them!
    • NOTE 3: All currency units are USD ($).

    Get Historical Values

    Let’s start by downloading a dummy Excel file which contains the recommended input format. In there, you will find three tabs which must be filled with your personal data:

    1. Portfolio: a summary of your investments. Each row represents a Stock and gathers some data from the other 2 tabs. The only inputs you have to fill are Stocks symbols or Tickers, and a given category you wish to group them by (US Stocks, International, Recommended by Bernardo…)
    2. Funds: here you will log any inputs or outputs of cash to your investment account. The required values are date and amount. There is an additional column for personal use to write notes and concepts if you want to.
    3. Transactions: this last tab will be your purchase log. You should write which, when, how many, and by how much did you buy each of your stocks.

    Now we get to the fun part: R! Even though you might have already installed the lares library before, I strongly recommend to update it with the following command because I’ve created some of the gathering functions recently (yesterday):

    devtools::install_github("laresbernardo/lares")
    

    NOTE: It may take a while to install the first time because I have some dependencies on other big libraries (like h2o ~123MB). But don’t worry, all of them are quite useful!

    After you have filled your data (or you might just want to try the dummy’s), we import it. To quicken the process, we can use the get_stocks function which automatically imports all tabs from your file and returns a list with these three tables.

    library(lares)
    df <- get_stocks(filename = "dummyPortfolio.xlsx")
    

    Calculations and Plots

    To understand where we are now we need to understand where we were before. Let’s download our historical data from the first day we purchased each stock until today included. After that, we automatically process (dplyr mostly) all the data in such a way that we can get the variance for each day, percentages, growth, etc. Finally, some nice plots (ggplot2 mostly) are created; even though they will have some redundant information, they will give us a wider perspective on our whole portfolio.

    For further customization, there are three parameters I’ve added to the function:

    1. tax: What percentage of your dividends does Uncle Sam (or equivalent) bite?
    2. expenses: How much does your bank or broker charges per transaction?
    3. cash_fix: Literally, how much do you want to sum to your current cash balance to fix it.

    Sometimes, the results need a little adjustment because of dividends not yet published or a little difference in quoting timings. Usually, I wouldn’t use this parameter.

    If your values are tax = 30, expenses = 7, cash_fix = 0, you can simply run the following code to process your portfolio’s data (if not, put them inside the function):

    dfp <- stocks_objects(df)
    

    That’s it! Now we have everything we need to visualize our stocks’ growth and portfolio’s performance. Let’s take a look at some of the plots created:

    First, I’d like to see an overall daily plot for my portfolio’s ups and downs. It is relevant to see percentages for daily changes and for absolute changes so we don’t panic when a crazy-steep-roller-coaster-day happens.

    print(dfp$p_portf_daily_change)
    

    Will show the following plot:

    Then, I’d like to see a plot with all my stocks and its numbers, order by relevance (value). We can see all of our stock’s current data (grey boxes at the left), how many we have and their current value. Next to it, at each bar’s foot, the amount invested and their weighted average purchase price. And the head of the bars, we have the earnings metrics: how much have they grown/shrank in absolute currency numbers or percentages. We can also see a symbol, located at today’s total value, that represents if the value has increased or decreased compared to your total stock investment.

    print(dfp$p_portf_stocks_change)
    

    Will plot the following:

    The next cool plot we get shows the daily percentage change since the first stock you purchased for each Ticker. The grids will group and plot each stock into the category you defined at your Excel’s Portfolio tab. There are also some points added at those days you did transactions; with those you can evaluate in the future if it was or not a good moment to buy/sell (don’t worry: no one can predict the future!)

    print(dfp$p_portf_stocks_histchange)
    

    Will generate this plot:

    Generate Report

    We can generate a nice HTML report with our portfolio’s performance using another quick command. It uses RMarkdown for rendering the plots and table into a single document. In addition to our prior plots, there is one more which shows the distribution of stocks into categories and a nice table with all the useful data summarizing everything up.

    stocks_html(dfp)
    

    Now you have a new nice HTML report created in your working directory. You can download this post’s report here.

    Extra tip

    RServer + cronR + mailR: RStudio in the cloud has indubitably been a great friend of mine for some time now. It automates daily tasks such as reporting, updating Google Sheets, sending mails, creating databases… and you only have to write the code once! It is a great way to get more independence from your company’s Tech Team. You could set a cronR job to send a daily or weekly report to your email automatically with this great tool.

    Hope you guys enjoyed this post. If you have any doubts, comments, pull requests, issues, just let me know! Please, do LinkedIn me if you want to connect.

    Thanks for your time 😉

    Related Post

    Add value to your visualizations in R

    $
    0
    0

    Category

    Tags

    One of the most demanded skills of the data analyst/scientist in 2018 is visualization. Organizations and companies have a huge demand for data visualization because this branch of methods is very efficient for the recognition of patterns and getting insight into big data.

    In this article, I show how you can add value to your visualizations by making them interactive with efficient packages in R. Get ready to utilize the power of: ggplot2, dygraphs and plotly!

    High quality visualizations with ggplot2

    ggplot2 was really a gamechanger in data science when it was realeased for R Statistical Computing in 2007. This package revolutionised the possibilities for coding high quality and elegant visualisations in data science software. The package have been optimised and updated since it was released. The below coding shows how you make different kinds of visualisations with ggplot2:

    # Load visualisation packages & datasets
    library(ggplot2)
    library(colorspace)
    library(datasets)
    head(iris)
    
    #Scatter plot with clusters
    spc<-ggplot(iris, aes(Petal.Length, Petal.Width, color = Species)) + geom_point()
    spc
    

    The above coding gives first a scatter cluster plot with ggplot2:

    # line plot
    lpc<-ggplot(iris, aes(x=Petal.Width, y=Petal.Length, group=Species)) +
      geom_line(aes(color=Species))+
      geom_point(aes(color=Species))
    lpc

    And it also display a cluster lineplot with ggplot2:

    Elegant and interactive visualizations with dygraphs

    Another value generating visualisation package in R is dygraphs. This package focuses on creating interactive visualisations with elegant interactive coding modules. Furthermore, the package specialises in creating visualisations for machine learning methods. The below coding generates different visualisation graphs with dygraphs:

    # Data management packages in R
    library(zoo)
    library(xts)
    # dygraphs in R
    library(dygraphs)
    # Generate dataset 
    value<-sample(100:800,100,replace = T)
    time<-seq(from=Sys.time(),to=Sys.time()+60*60*24*99,by="day")
    data<-data.frame(time=time,value=value)
    
    # dygraph lineplot
    dygraph(dy_data)
    

    The above coding generates the following interactive lineplot:

    # dygraph stepplot
    dygraph(dy_data)  %>% dyOptions(colors="red", pointSize = 2,drawGrid =T,stepPlot = T) %>% dyRangeSelector()
    

    Therafter it also creates the following interactive stepplot:

    Value-adding and interactive graphs with plotly

    The last package in this article about value adding visualisation packages in R is plotly. This package focuses on creating interactive and value-adding visualisations and has a clear design as well. The below coding creates different visualisations in plotly:

    #plotly graphs
    library(plotly)
    # Data management packages in R
    library(zoo)
    library(xts)
    # Generate dataset 
    value<-sample(100:800,100,replace = T)
    time<-seq(from=Sys.time(),to=Sys.time()+60*60*24*99,by="day")
    data<-data.frame(time=time,value=value)
    
    #plotly lineplot
    lp % add_trace(y = value,mode = 'lines')%>% 
    layout(title = "Generated dataset",
           xaxis = list(title = "Months"),
           yaxis = list (title = "Values"))
    lp
    

    The above coding gives us the following interactive line plot:

    #plotly line marker plot
    lm% add_trace(y = value,mode = 'lines+markers')%>%  
    layout(title = "Generated dataset",
           xaxis = list(title = "Months"),
           yaxis = list (title = "Values"))
    lm
    

    The new coding gives us an interactive line marker plot in plotly:

    #plotly marker plot
    m% add_trace(y = value,mode = 'markers')%>%  
      layout(title = "Generated dataset",
             xaxis = list(title = "Months"),
             yaxis = list (title = "Values"))
    m
    

    The 3rd coding gives us the following interactive marker plot in plotly:

    Enjoy your visualisations!

    References

    1. Using ggplot2 in R – CRAN.R-project.org
    2. Using dygraphs in R – CRAN.R-project.org
    3. Using plotly in R – CRAN.R-project.org

    Related Post

    Visualizations for credit modeling in R

    $
    0
    0

    Category

    Tags

    Visualization is a great way to get an overview of credit modeling. Typically you will start by making data management and data cleaning and after this, your credit modeling analysis will start with visualizations. This article is, therefore, the first part of a credit machine learning analysis with visualizations. The second part of the analysis will typically use logistic regression and ROC curves.

    Library of R packages

    In the following section we will use R for visualization of credit modelling. First we read the packages into the R library:

    # Data management packages
    library(readr) 
    library(lubridate)
    library(magrittr)
    library(plyr)
    library(dplyr) 
    library(gridExtra) 
    # Visualization packages
    library(ggplot2) 
    library(plotly)
    library(ggthemes) 
    

    Load dataset and data management

    Next it is time to read the dataset and do some data management. We use the lending club loan dataset:

    # Read the dataset into R library
    loan <- read.csv("/loan.csv")
    # Data management of the dataset
    loan$member_id <- as.factor(loan$member_id)
    loan$grade <- as.factor(loan$grade)
    loan$sub_grade <- as.factor(loan$sub_grade)
    loan$home_ownership <- as.factor(loan$home_ownership)
    loan$verification_status <- as.factor(loan$verification_status)
    loan$loan_status <- as.factor(loan$loan_status)
    loan$purpose <- as.factor(loan$purpose)
    

    After the above data management it is time for data selection and data cleaning:

    # Selection of variables for the analysis
    loan <- loan[,c("grade","sub_grade","term","loan_amnt","issue_d","loan_status","emp_length",
                              "home_ownership", "annual_inc","verification_status","purpose","dti",
                              "delinq_2yrs","addr_state","int_rate", "inq_last_6mths","mths_since_last_delinq",
                              "mths_since_last_record","open_acc","pub_rec","revol_bal","revol_util","total_acc")]
    # Data cleaningt for missing observations
    loan$mths_since_last_delinq[is.na(loan$mths_since_last_delinq)] <- 0
    loan$mths_since_last_record[is.na(loan$mths_since_last_record)] <- 0
    var.has.na <- lapply(loan, function(x){any(is.na(x))})
    num_na <- which( var.has.na == TRUE )	
    loan <- loan[complete.cases(loan),]
    skim(loan)
    Skim summary statistics
     n obs: 886877 
     n variables: 23 
    
    -- Variable type:factor --------------------------------------------------------
                variable missing complete      n n_unique                                       top_counts ordered
              addr_state       0   886877 886877       51      CA: 129456, NY: 74033, TX: 71100, FL: 60901   FALSE
              emp_length       0   886877 886877       12  10+: 291417, 2 y: 78831, < 1: 70538, 3 y: 69991   FALSE
                   grade       0   886877 886877        7       B: 254445, C: 245721, A: 148162, D: 139414   FALSE
          home_ownership       0   886877 886877        6   MOR: 443319, REN: 355921, OWN: 87408, OTH: 180   FALSE
                 issue_d       0   886877 886877      103   Oct: 48619, Jul: 45938, Dec: 44323, Oct: 38760   FALSE
             loan_status       0   886877 886877        8 Cur: 601533, Ful: 209525, Cha: 45956, Lat: 11582   FALSE
                 purpose       0   886877 886877       14 deb: 524009, cre: 206136, hom: 51760, oth: 42798   FALSE
               sub_grade       0   886877 886877       35       B3: 56301, B4: 55599, C1: 53365, C2: 52206   FALSE
                    term       0   886877 886877        2                   36: 620739,  60: 266138, NA: 0   FALSE
     verification_status       0   886877 886877        3     Sou: 329393, Ver: 290896, Not: 266588, NA: 0   FALSE
    
    -- Variable type:numeric -------------------------------------------------------
                   variable missing complete      n     mean       sd     p0      p25      p50      p75       p100     hist
                 annual_inc       0   886877 886877 75019.4  64687.38   0    45000    65000    90000    9500000    ????????
                delinq_2yrs       0   886877 886877     0.31     0.86   0        0        0        0         39    ????????
                        dti       0   886877 886877    18.16    17.19   0       11.91    17.66    23.95    9999    ????????
             inq_last_6mths       0   886877 886877     0.69     1      0        0        0        1         33    ????????
                   int_rate       0   886877 886877    13.25     4.38   5.32     9.99    12.99    16.2       28.99 ????????
                  loan_amnt       0   886877 886877 14756.97  8434.43 500     8000    13000    20000      35000    ????????
     mths_since_last_delinq       0   886877 886877    16.62    22.89   0        0        0       30        188    ????????
     mths_since_last_record       0   886877 886877    10.83    27.65   0        0        0        0        129    ????????
                   open_acc       0   886877 886877    11.55     5.32   1        8       11       14         90    ????????
                    pub_rec       0   886877 886877     0.2      0.58   0        0        0        0         86    ????????
                  revol_bal       0   886877 886877 16924.56 22414.33   0     6450    11879    20833    2904836    ????????
                 revol_util       0   886877 886877    55.07    23.83   0       37.7     56       73.6      892.3  ????????
                  total_acc       0   886877 886877    25.27    11.84   1       17       24       32        169    ????????
    

    Visualizations for credit modeling

    After loading the dataset and data management it is time to make the credit modelling visualizations in R:

    # Chart on customers
    ggplot(data = loan,aes(x = grade)) + geom_bar(color = "blue",fill ="green") +geom_text(stat='count', aes(label=..count..))+ theme_solarized()
    ggplotly(p = ggplot2::last_plot())
    

    The above coding gives us the following graph:

    Let’s look at which grading group are house owners:

    # Chart on customers living
    ggplot(data = loan,aes(x = home_ownership)) + geom_bar(color = "blue",fill ="green") +geom_text(stat='count', aes(label=..count..))+ theme_solarized()
    ggplotly(p = ggplot2::last_plot())
    

    This gives us the following bar plot:

    Now for the next visualizations, we need to make some data management:

    # Data management for loan status
    revalue(loan$loan_status, c("Does not meet the credit policy. Status:Charged Off" = "Charged Off")) -> loan$loan_status
    revalue(loan$loan_status, c("Does not meet the credit policy. Status:Fully Paid" = "Fully Paid")) -> loan$loan_status
    loan %>% group_by(loan$loan_status) %>% dplyr::summarize(total = n()) -> loan_status_data
    loan %>% group_by(loan$loan_status) %>% dplyr::summarize(total = n()) -> loan_status_data
    # Chart with customer living and loan status
    ggplot(data=loan, aes(x=home_ownership, fill=loan_status)) + geom_bar()
    ggplotly(p = ggplot2::last_plot())
    

    The above coding gives us the following visualization:

    Now lets look at customers on loan verification:

    # Customer and loan verification
    ggplot(data=loan, aes(x=verification_status, fill=loan_status))+ geom_bar()
    ggplotly(p = ggplot2::last_plot())
    

    This gives us the following plot:

    Lets look at the loan verification as loan amount and interest rate graph:

    # Loan amount
    ggplot(data = loan,aes(x = loan_amnt)) + geom_bar(color = 'green')
    ggplotly(p = ggplot2::last_plot())
    # Interest rate
    ggplot(data = loan,aes(x = int_rate))+ geom_bar(color = 'green')
    ggplotly(p = ggplot2::last_plot())
    

    This gives the following two graphs:

    Now lets look at histogram based upon loan amount and interest rate:

    #Histogram on loan amount
    ggplot(data = loan,aes (x = loan_amnt,fill= grade))+ geom_histogram()
    ggplotly(p = ggplot2::last_plot())
    #Histogram  on interest rate
    ggplot(data = loan,aes (x = int_rate,fill= grade))+ geom_histogram()
    ggplotly(p = ggplot2::last_plot())
    

    This gives us the following two histograms:

    Now let’s look at density plot based on interest rate and loan amount:

    # Density on interest rate
    ggplot(data = loan,aes(x = int_rate)) + geom_density(fill = 'green',color = 'blue')
    ggplotly(p = ggplot2::last_plot())
    # Density on loan amount
    ggplot(data = loan,aes(x = loan_amnt)) + geom_density(fill = 'green',color = 'blue')
    ggplotly(p = ggplot2::last_plot())
    

    This gives us the following density plots:

    Next, it is time to look at the density plot on loan- and interest rate based grade type

    #density on loan based on grade type
    ggplot(data = loan,aes(x = loan_amnt,fill = grade)) + geom_density()
    ggplotly(p = ggplot2::last_plot())
    #density on interest rate based on grade type
    ggplot(data = loan,aes(x = int_rate,fill = grade)) + geom_density()
    ggplotly(p = ggplot2::last_plot())
    

    This gives us the following plots:

    Lastly let us look at box plots for interest rate based on purpose and grade:

    # Box plot interest rate & purpose
    boxplot(int_rate ~ purpose, col="darkgreen", data=loan)
    # Boxplot interest rate & grade 
    boxplot(int_rate ~ grade, col="darkgreen", data=loan)
    

    The above coding gives us the following two histograms:


    References

    1. Using readr in R – CRAN.R-project.org
    2. Using lubridate in R – CRAN.R-project.org
    3. Using magrittr in R – CRAN.R-project.org
    4. Using plyr in R – CRAN.R-project.org
    5. Using dplyr in R – CRAN.R-project.org
    6. Using gridExtra in R – CRAN.R-project.org
    7. Using ggplot2 in R – CRAN.R-project.org
    8. Using plotly in R – CRAN.R-project.org
    9. Using ggthemes in R – CRAN.R-project.org

    Related Post

    Visualize your CV’s timeline with R (Gantt chart style)

    $
    0
    0

    Category

    Tags

    I have been improving my curriculum vitae (CV) these last days and what a nice idea came up: we can use R to generate a neat organized plot showing our different roles and jobs throughout the years. Not only it will draw our recruiters’ attention but you will also show some of your proficiency with visualizations. In my case, as a data scientist, that is one of the most important skills to have when showing your results to C-level guys or explaining a model’s performance to non-technical people.

    Install `lares` library

    As I usually do, I have already implemented the plot_timeline function in the `lares` library. Feel free to install it and use it with a simple line of code:

    devtools::install_github("laresbernardo/lares")
    

    NOTE: This will take a long time (~6min) to run if you have R installed without any of the super cool packages we analysts use (dplyr, ggplot2, rvest, h2o, lubridate…). I have also shared in some other posts some of the tasks we can do with the library such as whole dashboards in a plot to evaluate a classification model or a regression model or even your portfolio‘s performance. It is quite useful for data wrangling and EDAs as well.

    The plot

    So, let’s start with the final outcome: the plot.

    I know it is quite similar to a Gantt chart. That is why it is designed so you can actually use this same function to generate one. Instead of role you could write projects, for the labels you could show the product owners, for the colours the departments, etc.

    To run the plot_timeline function you should, at least, have the role (or event for more generic use), the start date and the end date. You can also add a group and label for each of your events. Then, you can customize little details such as title, subtitle, bars size, colour (for when no group is being used) and save to export as a file. Pretty straightforward!

    Let’s run the example showed above (easier if you load a CSV or XLSX file with the data):

    library(lares)
    
    order <- c("Role", "Place", "Type", "Start", "End")
    today <- as.character(Sys.Date())
    cv <- data.frame(rbind(
     c("Head of Data Science and Analytics", "Comparamejor", "Work Experience", "2016-08-01", today),
     c("Data Scientist Consultant", "MatrixDS", "Work Experience", "2018-09-01", today),
     c("Big Data & Data Science Programme", "UdC", "Academic", "2017-09-01", "2018-02-28"),
     c("Project Engineer", "Polytex", "Work Experience", "2016-05-15", "2016-09-01"),
     c("Big Data Analyst", "MEG", "Work Experience", "2016-01-01", "2016-04-30"),
     c("Advanced Excel Instructor", "ARTS", "Work Experience", "2015-11-01", "2016-04-30"),
     c("Continuous Improvement Intern", "PAVCO", "Work Experience", "2015-04-01", "2015-08-30"),
     c("Mechanical Design Intern", "SIGALCA", "Work Experience", "2013-07-01", "2013-09-30"),
     c("DJs Online Community Owner", "LaresDJ.com -> SoloParaDJs", "Extra", "2010-01-05", today),
     c("Mechanical Engineer Degree", "USB", "Academic", "2009-09-15", "2015-11-20"),
     c("DJ and Composer/Producer", "Legacy Discplay", "Extra", "2009-05-01", "2015-04-30")
    ))
    colnames(cv) <- order
    
    plot_timeline(event = cv$Role, 
                  start = cv$Start, 
                  end = cv$End, 
                  label = cv$Place, 
                  group = cv$Type,
                  save = FALSE)
    

    NOTE: Keep in mind that the plot will show your roles and jobs in the same order as you introduce them into the function. If you use the group parameter, it will also keep the arrangement but split the rows within the facets.

    I know there are loads of ways to do a CV, from a simple Word document to a Shiny dashboard or Latex. But that is the interesting thing about it: you can use your favorite tool to share your personal experience! In my case, I do love R, ggplot2, and nicely done visualizations (who doesn’t?).

    Further improvements

    We can also generate a `plotly` object, with the same template but adding more information when you hover over each role. For example, when you hover your mouse over a specific role in the plot, a popup little window will show the details you wish to display: job place, your specific responsibilities, successes, references. We could also create a scrapper with `rvest` and bring our Linkedin’s data to plot. These would be quite cool!

    If you want to improve this function or the plot’s aesthetics, please do so and share it with us. Always open to share and learn. All the code is hosted in the library’s site in Github. Hope you enjoyed this post!

    Related Post

    Introducing vizscorer: a bot advisor to score and improve your ggplot plots

    $
    0
    0

    Category

    Tags

    One of the most frustrating issues I face in my professional life is the plentitude of ineffective reports generated within my company. Wherever I look around me is plenty of junk charts, like barplot showing useless 3D effects or ambiguous and crowded pie charts.

    I do understand the root causes of this desperate state of the art: people have always less time to dedicate to reports crafting, and even less to dedicate to their plot. In the crazy and speedy-going working life, my colleagues have no time and for learning data visualization principles. Even so, this remains quite a big problem since a lot of time and money-wasting consequences come from poorly crafted reports and plots:

    • wrong conclusions about underlying phenomenon and wrong decisions?
    • requests for more clarifications about unclearly showed data?
    • ground for organizational politics due to lack of adequate evidence able to limit it

    That is why once I realized this sad truth I have started wondering what could have I done about that. Two options came to my mind:

    • sit down and blame the fate
    • face the problem and try to carve out some helpful solution

    Since I am a passionate follower of Steven Covey 7 habits, I decided to discard the first option and I devoted myself to find and put in place an helpful solution to the problem.

    A the end of the journey I came out with the vizscorer package. This package contains a mix of machine learning and natural language generation. All of these techniques are employed to analyze a plot and quickly show to the user how effective it is and how he can improve it.

    Three are the main tasks performed by vizscorer

    • analysing ggplot plot internals (only ggplot plots are supported)
    • scoring the plot based on its effectivenes
    • providing customised suggestion about how to improve it

    To unleash all this poweryou just have to run a simple function on your ggplot object:

    scorer_bot(plot_object= your_ggplot_object)
    

    But let us follow a decent chronological order, first of all showing you the route which led me to the package.

    How to measure a good plot?

    The first topic I faced in my quest for a better dataviz world was the clear-cut definition of a good plot. As Kant used to say: the aesthetic judgment is an individual judgment pretending to be universal (Immanuel Kant)

    This means that everyone has its own tastes about beauty (Kant's quote sounds fancier, doesn't it?). Defining and measuring the beauty of a plot is thus a non-trivial task. Even so, if we switch from the idea of measuring a nice-looking plot to the one of measuring an effective plot, the theory of data visualization comes to our help. What theory I am talking about? When we talk about data viz two are the pillars you cannot ignore:

    • The visual display of quantitative information by Edward R.Tufte
    • Show me the numbers by Stephen Few

    If you did not get the change to read them you can have a look at a reasoned summary of Tufte's theoretical framework I crafted within a previous post. Unfortunately, I couldn't find any effective summary of Few's ideas.

    Anyway, looking at these books you will find out that an effective plot should respect some common principles. These principles are for instance integrity, readability and maximization of data to ink ratio.

    This is all nice, at least for me, but how to measure the effectiveness of a plot given these principles?

    Preparing a training dataset of plots

    The first step I moved toward this direction was taking a handful of fewer than 100 ggplot plots and score them as good or bad. I assigned the score based on my expert judgment about the level of compliance with mentioned principles (No surprise about my passion for compliance, I am an auditor after all). You are thinking it is too rough, aren't you? Well, I will give you two different answers:

    • this is the first step, and we will add on it more robust statistical tools and reasoning later
    • this is not different from what Google do when dealing with quality of photo and images

    Once this was done I need some way to associate the 0-1 flag with the attributes of each plot. That is why I wrote an R function able to look within ggplot object internals and get out from it precious info.

    You can still find this function within the vizscorer package:

    metadata_reader(plot_object = "your_ggplot_plot")
    

    You can imagine it as a way to teach computers how to look at plots and describe them. A the beginning the function tests the plot to understand which type of plot it is. This is done looking for geometries and aesthetics. As a next step the function performs studies on data visualized from the ggplot object. These studies try to understand relationships among variables and the presence of outliers. Finally, some tests are performed to verify the respect of data visualization principles. This is done leveraging information from mentioned analyses.

    Fifteen attributes related to four areas of data visualization effectiveness are then saved in a data frame:

    • readability of the plot, like the correct specification of the number of bins given the distribution of data
    • data density, like the presence of overplotting phenomenons
    • data to ink ratio, like the use of meaningless filled bars in bar plot
    • adequateness of labelling, like the presence of adequate labelling for axes

    Once having run this function on my training plots, I came out with a training database. This database showed for each plot the 0-1 flag I assigned and all data drawn from the function.

    Wasn't it a perfect occasion to apply some machine learning? I thought it was.

    How to train Machine Learning to recognize a good plot?

    What I was looking at that stage was a classification problem. The goal here was to predict if a given plot was good or bad based on a set of attributes related to the plot.

    I could have resorted to different algos and models able to perform this task. In the end, I decided to apply a gradient boosting model. This model resulted able to provide the classification in the form of a probability.

    This means that for each plot the algorithm is able to tell me how probable is for the plot to be a good one or a bad one.

    No point in getting here into details with the algo, we can just remember that:

    • it works fitting various decision trees on your data and summing their predictions.
    • it is a boosting method. This means that after the first fitting round it takes the observed errors and fits another set of trees on these errors

    You can find a nice interactive explanation by Alex Rogozhnikov on its personal website.

    Can Machine learning talk back to humans?

    We have now a model able to score a plot given a set of attributes. It was quite exciting to come that far, but still, this was not the end. I could indeed imagine my colleagues looking at the score given to one of their plots, then turning back to me and asking: and so what?

    I was missing the last mile: teaching to the author of the plot how to improve it.

    To do this I tried to develop a basic natural language generation engine. This engine performs three kinds of stuff:

    • taking the final score of the model from gradient boosting algo
    • analysing the internal data drawn for the plot desuming disregarded principles
    • retrieving from a knowledge base information to describe the results and provide suggestions about how to improve the plot

    At the end of the process, leveraging knitr, a nice deck of revealjs slides is produced to help the user navigate evaluations and suggestions back and forward.

    Putting all together: vizscorer and the scorer_bot

    Once all of this was done, to make it available to my colleagues and the R users I developed the vizscorer package.

    You can try the package for yourself installing it from Github with the following code:

    devtools::install_github("andreacirilloac/vizscorer")
    

    Let us see it in action:

    As you see, there is no that much to do for the user. He just has to submit its ggplot plot to the scorer_bot function and an easy-going deck of slides pops up. The slides coming out are packed with customized suggestions about how to improve the plot.

    Where to go from here and how to help

    The package is currently in a primordial phase. Even if it is able to perform the tasks described I can see several development directions:

    • increasing the number of plots employed for training the gradient boosting model
    • introducing a “console version” of the report, more usable and less annoying in the long run
    • increasing the level of cleaverness of the bot to make it able to analyse more complex plots and provide even more useful suggestions

    Vizscorer continues the effort started with paletteR to increase the level of quality of the average plots produced in companies where there is no time to study the data visualization theory

    If you also think the quality and integrity of companies reports is a right reason to code for, you are more then welcome on the official Github repository of vizscorer.

    Both in case you will contribute to it or not, comments are welcome about how helpful vizscorer can be and how to improve it.

    Related Post

    Visualization of NYC bus delays with R

    $
    0
    0

    Category

    Tags

    The motivation for choosing this data set to explore is straightforward: I wanted a real-world data set for which additional meta data would be easy to find, making NYC data perfect; I wanted something which did not require specialised domain knowledge, and so buses are a good choice; and I wanted a data set that might produce some interesting insights. As an additional bonus, this data set had very few downloads or kernels on Kaggle, so it seemed like mostly untrodden ground.

    Data loading and initial exporation

    Data are available from the NYC open data site. Linked is the main data page, which contains the bus breakdown ID number, as well as the route number, the schools serviced, the borough through which the bus travels, and so on.

    The readme file included in this bundle also contains references to linking information. Specifically, the drivers and attendants, routes, transportation sites, vehicles, pre-k riders by transportation site, routes by transportation site, and pre-k vendors by transportation site. All of this data can be combined (see later) to provide route- and vendor- level data to the main delay data set. For example, to quanitfy the total number of drivers employed by each company, the total number of students or schools that they service, and so on.

    Our goal is to be able to make some kind of useful prediction about how long a bus is going to be delayed, at the time its delay is called into the operations centre. So we take a look at our primary 'ii_' data set.

    in_csv <- "../data/II_Bus_Breakdown_and_Delays.csv"
    ii_breakdowns <- read_csv(in_csv)
    ii_breakdowns %>% glimpse
    ## Observations: 259,637
    ## Variables: 21
    ## $ School_Year                     <chr> "2015-2016", "2015-2016", "201...
    ## $ Busbreakdown_ID                 <int> 1212699, 1212700, 1212701, 121...
    ## $ Run_Type                        <chr> "Special Ed AM Run", "Special ...
    ## $ Bus_No                          <chr> "48186", "2518", "235", "2102"...
    ## $ Route_Number                    <chr> "N758", "L530", "K168", "K216"...
    ## $ Reason                          <chr> "Other", "Mechanical Problem",...
    ## $ Schools_Serviced                <chr> "75485", "21854", "18366", "21...
    ## $ Occurred_On                     <dttm> 2015-09-02 06:27:00, 2015-09-...
    ## $ Created_On                      <dttm> 2015-09-02 06:29:00, 2015-09-...
    ## $ Boro                            <chr> "Nassau County", "Brooklyn", "...
    ## $ Bus_Company_Name                <chr> "BORO TRANSIT, INC.", "RELIANT...
    ## $ How_Long_Delayed                <chr> "25 minutes", NA, "30MINS", "2...
    ## $ Number_Of_Students_On_The_Bus   <int> 0, 0, 0, 1, 0, 0, 0, 9, 0, 2, ...
    ## $ Has_Contractor_Notified_Schools <chr> "Yes", "Yes", "Yes", "Yes", "Y...
    ## $ Has_Contractor_Notified_Parents <chr> "No", "Yes", "Yes", "Yes", "Ye...
    ## $ Have_You_Alerted_OPT            <chr> "No", "Yes", "No", "No", "No",...
    ## $ Informed_On                     <dttm> 2015-09-02 06:29:00, 2015-09-...
    ## $ Incident_Number                 <chr> NA, NA, NA, NA, NA, NA, NA, NA...
    ## $ Last_Updated_On                 <dttm> 2015-09-02 06:29:16, 2015-09-...
    ## $ Breakdown_or_Running_Late       <chr> "Running Late", "Breakdown", "...
    ## $ School_Age_or_PreK              <chr> "School-Age", "School-Age", "S...
    
    ii_breakdowns %>% distinct(How_Long_Delayed) %>% head(n=20)
    ## # A tibble: 20 x 1
    ##    How_Long_Delayed
    ##    <chr>           
    ##  1 25 minutes      
    ##  2 <NA>            
    ##  3 30MINS          
    ##  4 20 min          
    ##  5 30 min          
    ##  6 90 MIN          
    ##  7 20 MINS         
    ##  8 20              
    ##  9 30 mins         
    ## 10 15 MINS         
    ## 11 20 MIN          
    ## 12 15 mins         
    ## 13 30 MINS         
    ## 14 25              
    ## 15 0               
    ## 16 10 mins         
    ## 17 25 min          
    ## 18 1hr             
    ## 19 20 mins         
    ## 20 45 mins
    

    There is an obvious problem: these delays are 'human recorded', meaning that the format is inconsistent. Sometimes we have minutes, min, mts, hours, hrs; sometimes just two numbers separated by ':', and so on. Additionally, the times are not accurately recorded, as we will verify in a moment.

    Wrangling the delay times into something machine readable takes some doing. I don't doubt that there is a more general path available, but I went through sequentially, case by case, as generally as I could; then cleaned up the rest at the end.

    #--sequential clean
    ii_times <- ii_breakdowns %>%
      mutate(units_delayed = str_extract(How_Long_Delayed, "[:alpha:]+"),
        time_delayed = as.numeric(str_extract(How_Long_Delayed, "[:digit:]+")),
        units_delayed = ifelse(str_detect(units_delayed, "^[mM]"), "minutes", "other"),
        units_delayed = ifelse(is.na(units_delayed), "other", units_delayed)
        ) %>%
      #remove "in" case, exclude any flagged with "[hH}"
      mutate(
        units_delayed = ifelse(units_delayed=="other" & str_detect(How_Long_Delayed, "in")  & !str_detect(How_Long_Delayed, "[hH]"),"minutes", units_delayed)
      ) %>%
      #deal with "to" case with minutes by taking only the first number. There are apparently no 'to' strings with hours in them.
      mutate(
        units_delayed = ifelse(units_delayed=="other" & str_detect(How_Long_Delayed, "to") & str_detect(How_Long_Delayed, "[mM]"),"minutes", units_delayed)
      ) %>%
      #deal with the - cases which don't involve hours at all
      mutate(
        units_delayed = ifelse(units_delayed=="other" & str_detect(How_Long_Delayed, "-") & !str_detect(How_Long_Delayed, "[hH]"),"minutes", units_delayed)
      ) %>%
      #deal with the double digit minute-1hr:
      mutate(
        units_delayed = ifelse(units_delayed=="other" & str_detect(How_Long_Delayed, "-") & str_detect(How_Long_Delayed, "^[1-5][0-9]"),"minutes", units_delayed)
      ) %>%
      #everything left with a hyphen is a 1 hour or more delay
      mutate(
        time_delayed = ifelse(units_delayed=="other" & str_detect(How_Long_Delayed, "-"), 60, time_delayed),
        units_delayed = ifelse(units_delayed=="other" & str_detect(How_Long_Delayed, "-"), "minutes", units_delayed)
      ) %>%
      #-all hyphens dealt with at this point
      #Now work on the "/": first take the minute timers: all those with double digits first
      mutate(
        units_delayed = ifelse(units_delayed=="other" & str_detect(How_Long_Delayed, "/") & str_detect(How_Long_Delayed, "^[1-9][0-9]"), "minutes", units_delayed)
      ) %>%
      #All those starting with 1/2 go to 30 minutes
      mutate(
        time_delayed = ifelse(units_delayed=="other" & str_detect(How_Long_Delayed, "^1/2"), 30, time_delayed),
        units_delayed = ifelse(units_delayed=="other" & str_detect(How_Long_Delayed, "^1/2"), "minutes", units_delayed)
      ) %>%
      #All those starting with 1 1/2 go to 90 minutes
      mutate(
        time_delayed = ifelse(units_delayed=="other" & str_detect(How_Long_Delayed, "^1 1/2"), 90, time_delayed),
        units_delayed = ifelse(units_delayed=="other" & str_detect(How_Long_Delayed, "^1 1/2"), "minutes", units_delayed)
      ) %>%
      #---specific cases
      #"1 HOUR1/2"
      mutate(
        time_delayed = ifelse(units_delayed=="other" & How_Long_Delayed == "1 HOUR1/2", 90, time_delayed),
        units_delayed = ifelse(units_delayed=="other" & How_Long_Delayed == "1 HOUR1/2", "minutes", units_delayed)
      ) %>%
      #"@least 1/2"
      mutate(
        time_delayed = ifelse(units_delayed=="other" & How_Long_Delayed == "@least 1/2", 30, time_delayed),
        units_delayed = ifelse(units_delayed=="other" & How_Long_Delayed == "@least 1/2", "minutes", units_delayed)
      ) %>%
      #"1HR/20MIN"
      mutate(
        time_delayed = ifelse(units_delayed=="other" & How_Long_Delayed == "1HR/20MIN", 80, time_delayed),
        units_delayed = ifelse(units_delayed=="other" & How_Long_Delayed == "1HR/20MIN", "minutes", units_delayed)
        )%>%
      #--end specific cases
      #1hr/x case
      #This is modifying things it shouldn't. Why is this even here?
      mutate(
        time_delayed = ifelse(units_delayed=="other" & str_detect(How_Long_Delayed, "1hr"), 60, time_delayed),
        units_delayed = ifelse(units_delayed=="other" & str_detect(How_Long_Delayed, "1hr"), "minutes", units_delayed)
      )%>%
      #---cases with ":"
      #remove cases which erroneously report a time instead of a duration, since these are not reliable
      mutate(
        time_delayed = ifelse(units_delayed=="other" & str_detect(How_Long_Delayed, ":") & str_detect(How_Long_Delayed, "[aA][mM]"), NA, time_delayed)
      )%>%
      #2:hr cases
      mutate(
        time_delayed = ifelse(units_delayed=="other" & str_detect(How_Long_Delayed, "^2:[hH][rR]"), 120, time_delayed),
        units_delayed = ifelse(units_delayed=="other" & str_detect(How_Long_Delayed, "^2:[hH][rR]"), "minutes", units_delayed)
      )%>%
      #1:45 cases
      mutate(
        time_delayed = ifelse(units_delayed=="other" & str_detect(How_Long_Delayed, "^1:45"), 105, time_delayed),
        units_delayed = ifelse(units_delayed=="other" & str_detect(How_Long_Delayed, "^1:45"), "minutes", units_delayed)
      )%>%
      #1:30 cases
      mutate(
        time_delayed = ifelse(units_delayed=="other" & str_detect(How_Long_Delayed, "^1:30"), 90, time_delayed),
        units_delayed = ifelse(units_delayed=="other" & str_detect(How_Long_Delayed, "^1:30"), "minutes", units_delayed)
      )%>%
      #1: cases
      mutate(
        time_delayed = ifelse(units_delayed=="other" & str_detect(How_Long_Delayed, "^1:"), 60, time_delayed),
        units_delayed = ifelse(units_delayed=="other" & str_detect(How_Long_Delayed, "^1:"), "minutes", units_delayed)
      )%>%
      #--end cases with ":"
      #--cases with "^2"
      #2 hr cases
      mutate(
        time_delayed = ifelse(units_delayed=="other" & str_detect(How_Long_Delayed, "^2") & str_detect(How_Long_Delayed, "[hH]"), 120, time_delayed),
        units_delayed = ifelse(units_delayed=="other" & str_detect(How_Long_Delayed, "^2") & str_detect(How_Long_Delayed, "[hH]"), "minutes", units_delayed)
      )%>%
      #double digit minute cases:
      mutate(
        units_delayed = ifelse(units_delayed=="other" & str_detect(How_Long_Delayed, "^2[0-9]"), "minutes", units_delayed) #times are already correct
      )%>%
      #---"^1"
      #1 hour cases
      mutate(
        time_delayed = ifelse(units_delayed=="other" & str_detect(How_Long_Delayed, "^1.*[rR]$") & !(str_detect(How_Long_Delayed, "^1.5.*[rR]$")), 60, time_delayed),
        units_delayed = ifelse(units_delayed=="other" & str_detect(How_Long_Delayed, "^1.*[rR]$") & !(str_detect(How_Long_Delayed, "^1.5.*[rR]$")), "minutes", units_delayed)
      )%>%
      #1.5 hour cases
      mutate(
        time_delayed = ifelse(units_delayed=="other" & str_detect(How_Long_Delayed, "^1.5"), 90, time_delayed),
        units_delayed = ifelse(units_delayed=="other" & str_detect(How_Long_Delayed, "^1.5"), "minutes", units_delayed)
      )%>%
      #NR: some of the ^1 x min cases going in here are already tagged as minutes.
      #1 hr 30 cases
      mutate(
        time_delayed = ifelse(units_delayed=="other" & str_detect(How_Long_Delayed, "^1") & str_detect(How_Long_Delayed, "30"), 90, time_delayed),
        units_delayed = ifelse(units_delayed=="other" & str_detect(How_Long_Delayed, "^1") & str_detect(How_Long_Delayed, "30"), "minutes", units_delayed)
      )%>%
      #1 hr 15 cases
      mutate(
        time_delayed = ifelse(units_delayed=="other" & str_detect(How_Long_Delayed, "^1") & str_detect(How_Long_Delayed, "15"), 75, time_delayed),
        units_delayed = ifelse(units_delayed=="other" & str_detect(How_Long_Delayed, "^1") & str_detect(How_Long_Delayed, "15"), "minutes", units_delayed)
      )%>%
      #1 hr 20 cases
      mutate(
        time_delayed = ifelse(units_delayed=="other" & str_detect(How_Long_Delayed, "^1") & str_detect(How_Long_Delayed, "20"), 80, time_delayed),
        units_delayed = ifelse(units_delayed=="other" & str_detect(How_Long_Delayed, "^1") & str_detect(How_Long_Delayed, "20"), "minutes", units_delayed)
      )%>%
      #1 hr 45 cases
      mutate(
        time_delayed = ifelse(units_delayed=="other" & str_detect(How_Long_Delayed, "^1") & str_detect(How_Long_Delayed, "45"), 105, time_delayed),
        units_delayed = ifelse(units_delayed=="other" & str_detect(How_Long_Delayed, "^1") & str_detect(How_Long_Delayed, "45"), "minutes", units_delayed)
      )%>%
      #1 hr half
      mutate(
        time_delayed = ifelse(units_delayed=="other" & str_detect(How_Long_Delayed, "^1") & str_detect(How_Long_Delayed, "half"), 90, time_delayed),
        units_delayed = ifelse(units_delayed=="other" & str_detect(How_Long_Delayed, "^1") & str_detect(How_Long_Delayed, "half"), "minutes", units_delayed)
      )%>%
      #1 h cases
      mutate(
        time_delayed = ifelse(units_delayed=="other" & str_detect(How_Long_Delayed, "^1") & str_detect(How_Long_Delayed, "[hH]"), 60, time_delayed),
        units_delayed = ifelse(units_delayed=="other" & str_detect(How_Long_Delayed, "^1") & str_detect(How_Long_Delayed, "[hH]"), "minutes", units_delayed)
      )%>%
      #---has pattern "^[1-9][oO]", that is, o replaces 0
      mutate(
        time_delayed = ifelse(units_delayed=="other" & str_detect(How_Long_Delayed, "^[1-9][oO]"), time_delayed*10, time_delayed),
        units_delayed = ifelse(units_delayed=="other" & str_detect(How_Long_Delayed, "^[1-9][oO]") , "minutes", units_delayed)
      ) %>%
      #---final outliers and rejects
      #just switch to minutes
      mutate(
        units_delayed = ifelse(How_Long_Delayed == "35 SM", "minutes", units_delayed),
        units_delayed = ifelse(How_Long_Delayed == "30am", "minutes", units_delayed),
        units_delayed = ifelse(How_Long_Delayed == "30INS", "minutes", units_delayed),
        units_delayed = ifelse(How_Long_Delayed == "45 late", "minutes", units_delayed),
        units_delayed = ifelse(How_Long_Delayed == "40n", "minutes", units_delayed),
        units_delayed = ifelse(How_Long_Delayed == "45 am", "minutes", units_delayed),
        units_delayed = ifelse(How_Long_Delayed == "45NIN", "minutes", units_delayed),
        units_delayed = ifelse(How_Long_Delayed == "45 INUTES", "minutes", units_delayed),
        units_delayed = ifelse(How_Long_Delayed == "45IN", "minutes", units_delayed)
      ) %>%
      #needs time modifications
      mutate(
        time_delayed = ifelse(How_Long_Delayed == "!0 mins", 1, time_delayed),
        time_delayed = ifelse(How_Long_Delayed == "0-15 Min", 5, time_delayed),
        time_delayed = ifelse(How_Long_Delayed == "0-15 Min", 5, time_delayed),
        time_delayed = ifelse(How_Long_Delayed == "MAYBE 1/2", 30, time_delayed),
        units_delayed = ifelse(How_Long_Delayed == "half hour", "minutes", units_delayed),
        time_delayed = ifelse(How_Long_Delayed == "Half hour", 30, time_delayed),
        units_delayed = ifelse(How_Long_Delayed == "Half hour", "minutes", units_delayed),
        time_delayed = ifelse(How_Long_Delayed == "one hour", 60, time_delayed),
        units_delayed = ifelse(How_Long_Delayed == "one hour", "minutes", units_delayed),
        time_delayed = ifelse(How_Long_Delayed == "ONE HOUR", 60, time_delayed),
        units_delayed = ifelse(How_Long_Delayed == "ONE HOUR", "minutes", units_delayed),
        time_delayed = ifelse(How_Long_Delayed == "HOUR", 60, time_delayed),
        units_delayed = ifelse(How_Long_Delayed == "HOUR", "minutes", units_delayed),
        time_delayed = ifelse(How_Long_Delayed == "hour", 60, time_delayed),
        units_delayed = ifelse(How_Long_Delayed == "hour", "minutes", units_delayed),
        time_delayed = ifelse(How_Long_Delayed == "HR1", 60, time_delayed),
        units_delayed = ifelse(How_Long_Delayed == "HR1", "minutes", units_delayed),
        time_delayed = ifelse(How_Long_Delayed == "1/ 15 min", 75, time_delayed),
        time_delayed = ifelse(How_Long_Delayed == "1:20MIN", 80, time_delayed),
        time_delayed = ifelse(How_Long_Delayed == "1 20 min", 80, time_delayed),
        time_delayed = ifelse(How_Long_Delayed == "1:30 min", 90, time_delayed),
        time_delayed = ifelse(How_Long_Delayed == "1:30?mins", 90, time_delayed),
        time_delayed = ifelse(How_Long_Delayed == "1 30mnts", 90, time_delayed),
        time_delayed = ifelse(How_Long_Delayed == "1 30 min", 90, time_delayed),
        time_delayed = ifelse(How_Long_Delayed == "1:40 MINS", 90, time_delayed),
        time_delayed = ifelse(How_Long_Delayed == "IHR40MIN", 100, time_delayed),
        units_delayed = ifelse(How_Long_Delayed == "IHR40MIN", "minutes", units_delayed),
        time_delayed = ifelse(How_Long_Delayed == "3 HRS", 180, time_delayed),
        units_delayed = ifelse(How_Long_Delayed == "3 HRS", "minutes", units_delayed),
        time_delayed = ifelse(How_Long_Delayed == "3 hr", 180, time_delayed),
        units_delayed = ifelse(How_Long_Delayed == "3 hr", "minutes", units_delayed),
        time_delayed = ifelse(How_Long_Delayed == "3 HOUR", 180, time_delayed),
        units_delayed = ifelse(How_Long_Delayed == "3 HOUR", "minutes", units_delayed),
        time_delayed = ifelse(How_Long_Delayed == "4 hours", 240, time_delayed),
        units_delayed = ifelse(How_Long_Delayed == "4 hours", "minutes", units_delayed),
        time_delayed = ifelse(How_Long_Delayed == "4 hrs", 240, time_delayed),
        units_delayed = ifelse(How_Long_Delayed == "4 hrs", "minutes", units_delayed)
      ) %>%
      #sometimes the record just reads 'mins' or equivalent. My 'units_delayed' picks this up as 'minutes'. We take a guess and set this to 5 minutes.
      mutate(
        time_delayed = ifelse(units_delayed == "minutes" & str_detect(How_Long_Delayed, "[mM][iI][nN]") & is.na(time_delayed), 5, time_delayed)
      ) %>%
      filter(!(is.na(time_delayed))) %>%
      filter(time_delayed <= 300) %>% #Any delays beyond 5 hours are probably typos, but also problematic if real.
      filter(units_delayed == "minutes") %>% #222 820 / 259 637. The rest are garbage or NA.
      select(
        Busbreakdown_ID, School_Year, Route_Number, Schools_Serviced, Bus_Company_Name,
        Has_Contractor_Notified_Schools, Has_Contractor_Notified_Parents, Have_You_Alerted_OPT, Reason,
        Boro, Number_Of_Students_On_The_Bus, School_Age_or_PreK,
        Created_On, Occurred_On,
        time_delayed
      )
    
    #---plot of the time_delayed
    library(RColorBrewer)
    
    pal <- brewer.pal(12, "Paired")
    
    reason_levels <- ii_times %>%
      group_by(Reason) %>%
      mutate(
        total_of_reason = n()
      ) %>% distinct(Reason, total_of_reason) %>%
        arrange(total_of_reason) %>%
      ungroup() %>%
      mutate(total_of_reason = row_number())
    
    ii_times %>%
      mutate(Reason = factor(Reason, levels = reason_levels[[1]])) %>%
      mutate(time_delayed = time_delayed) %>%
      ggplot(aes(x = time_delayed, fill = Reason)) +
      geom_bar() +
      theme_classic() +
      scale_fill_manual(values = pal) +
      coord_cartesian(expand = c(0,0), xlim = c(0, 100)) +
      labs(x="time_delayed [min]",y="Observations") +
      theme(text=element_text(family="Arial", size=16)) +
      theme(axis.line = element_line(colour = 'black', size = 1)) +
      theme(axis.ticks = element_line(colour = "black", size = 1)) +
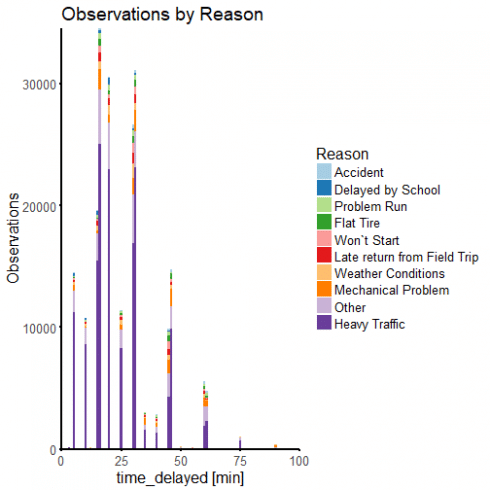
      ggtitle("Observations by Reason")
    

    A bar graph broken up Reason shows that, as observed when cleaning up the delay data, these are 'human approximated delays'. The driver or attendant (or perhaps someone at operations) has approximated the delay to the nearest convenient time package: 5 minutes, 10 minutes, 15 minutes, 20, 25, 30, 40, 45, 50, 60, 90 minutes, and so on. Some delays have been figured out more accurately by comparing time differences, but most have not. One of the consequences is that if we decide to run a regression model for this data, we can never expect it to be more precise than 5-10 minutes of RMS error. Because that is how the data have been recorded.

    Note that there are a few data with delays beyond 100 minutes, and these points will show up later. The graph is presented this way for clarity. Traffic constitutes the major source of delay in the data set; accident is the most rare problem. 'Other', meaning a missing reason or undisclosed reason, is the second most common value in this field.

    We can have a look at some of the structure via density plots:

    ii_times %>%
      mutate(Reason = factor(Reason, levels = reason_levels[[1]])) %>%
      mutate(time_delayed = time_delayed) %>%
      ggplot(aes(x = time_delayed, fill = Reason)) +
      geom_density(aes(y=..count..), size = 0, adjust = 4, position = "stack", color = NA) +
      theme_classic() +
      scale_fill_manual(values = pal) +
      coord_cartesian(expand = c(0,0), xlim = c(0, 100)) +
      labs(x="time_delayed [min]",y="Observation count") +
      theme(text=element_text(family="Arial", size=16)) +
      theme(axis.line = element_line(colour = 'black', size = 1)) +
      theme(axis.ticks = element_line(colour = "black", size = 1)) +
      ggtitle("Density: observations by Reason")
    

    boro_levels <- ii_times %>%
      mutate(
        Boro = ifelse(is.na(Boro), "All Boroughs", Boro),
      ) %>%
      group_by(Boro) %>%
      mutate(
        total_of_boro = n()
      ) %>% distinct(Boro, total_of_boro) %>%
      arrange(total_of_boro) %>%
      ungroup() %>%
      mutate(total_of_boro = row_number())
    
    ii_times %>%
      mutate(
        Boro = ifelse(is.na(Boro), "All Boroughs", Boro),
      ) %>%
      mutate(Boro = factor(Boro, levels = boro_levels[[1]])) %>%
      ggplot(aes(x = time_delayed, fill = Boro)) +
      geom_density(aes(y=..count..), size = 0, adjust = 4, position = "stack", color = NA) +
      theme_classic() +
      scale_fill_manual(values = pal) +
      coord_cartesian(expand = c(0,0), xlim = c(0, 100)) +
      labs(x="time_delayed [min]",y="Observation count") +
      theme(text=element_text(family="Arial", size=16)) +
      theme(axis.line = element_line(colour = 'black', size = 1)) +
      theme(axis.ticks = element_line(colour = "black", size = 1)) +
      ggtitle("Density: observations by Borough")
    

    Here we must be careful with interpretation, since the density plot presents counts convolved with a gaussian density kernel. This helps us to see structure, but we must be careful interpreting the counts. There are still very few observations with delay time of 22 minutes, for example.

    But we can see some structure a little more clearly. For example, Manhattan produces more long-time delays than the Bronx or Staten Island.

    In the next set of notes we will try to fit a regression, based only on this data. However, we can already see the need to join more data on as we have few predictors. Before building a model or joining to the other data sets, there is a little more cleaning and dummifying of categorical variables to do:

    ii_spread <- ii_times %>%
      mutate(
        time_diff_report = abs(as.numeric(difftime(Created_On, Occurred_On, units = "mins"))) 
      ) %>%
      mutate(
        reported_before_resolved = (time_delayed > time_diff_report)*1L,
        Created_On = NULL,
        Has_Contractor_Notified_Schools = (Has_Contractor_Notified_Schools == "Yes")*1L,
        Has_Contractor_Notified_Parents = (Has_Contractor_Notified_Parents == "Yes")*1L,
        Have_You_Alerted_OPT = (Have_You_Alerted_OPT == "Yes")*1L,
        School_Age = (School_Age_or_PreK == "School-Age")*1L,
        School_Age_or_PreK = NULL
      ) %>%
      mutate(dummy = 1L,
        Reason = str_replace_all(Reason, " ", ""),
        Reason = str_replace_all(Reason, "\`", "")
        ) %>%
      spread(key = Reason, value = dummy, fill = 0L, sep = "_") %>%
      mutate(Reason_Other = NULL) %>% #default case is Other
      mutate(dummy = 1L,
        Boro = ifelse(is.na(Boro), "All Boroughs",Boro),
        Boro = str_replace_all(Boro, " ", "")
      ) %>%
      spread(key = Boro, value = dummy, fill = 0L, sep = "_") %>%
      mutate(Boro_AllBoroughs = NULL) %>% #default case is all
      mutate(
        Number_Of_Students_On_The_Bus = as.numeric(Number_Of_Students_On_The_Bus) #This field has some problems we will deal with later
      ) %>%
      filter(Number_Of_Students_On_The_Bus <= 80) #Although this cut is arbitrary, we choose not to believe the records with more than 80 people on the bus.
    

    Related Post

    Failure Pressure Prediction Using Machine Learning

    $
    0
    0

    Category

    Tags

    In this post, the failure pressure will be predicted for a pipeline containing a defect based solely on burst test results and learning machine models. For this purpose, various Machine Learning models will be fitted to test data under R using the caret package, and in the process compare the accuracy of the models in order to identify the best performing one(s).

    Importing The Data

    The data set to be used, has been extracted from an extensive database of burst test results, the set contains the results of approximately 313 tests which were compiled by GL in 2009. Report as well as the data used here can be obtained using this link.

    The data was extracted and inserted into a CSV file, allowing for it to be called and manipulated easily.

    Data used in this tutorial can be found in this file.

    Burst Data

    We will start by loading all libraries needed to run the analysis and the data set.

    library(caret)
    library(caretEnsemble)
    library(ggforce)
    library(ggplot2)
    library(gridExtra)
    Burst_Tests_Data <- read.csv(file="F:/kamel/Burst Data.csv", header=TRUE, sep=",")
    # Summary of the data is shown below:  
      summary(Burst_Tests_Data)
    ##        INDEX              Source_Reference     Grade       OD_by_WT     
    ##  INDEX 1  :  1   BRITISH GAS RING1:  1     X52    :58   Min.   :  8.60  
    ##  INDEX 10 :  1   BRITISH GAS RING2:  1     B      :50   1st Qu.: 46.20  
    ##  INDEX 100:  1   BRITISH GAS RING3:  1     X60    :46   Median : 57.90  
    ##  INDEX 101:  1   BRITISH GAS RING4:  1     X65    :44   Mean   : 58.77  
    ##  INDEX 102:  1   BRITISH GAS RING5:  1     X100   :41   3rd Qu.: 70.70  
    ##  INDEX 103:  1   BRITISH GAS RING6:  1     X46    :41   Max.   :111.10  
    ##  (Other)  :307   (Other)          :307     (Other):33                   
    ##    Defect_Type   Norm_Length         d_by_WT        YS_by_SMYS 
    ##  Machined:180   Min.   :  0.228   Min.   :0.089   1.134  : 41  
    ##  Real    :133   1st Qu.:  1.594   1st Qu.:0.448   N/A    : 19  
    ##                 Median :  3.549   Median :0.586   1.194  : 17  
    ##                 Mean   : 36.323   Mean   :0.567   1.117  : 11  
    ##                 3rd Qu.:  9.878   3rd Qu.:0.715   1.211  : 10  
    ##                 Max.   :284.164   Max.   :1.000   1.092  :  9  
    ##                                                   (Other):206  
    ##   UTS_by_SMTS    YS_by_UTS   Failure_Mode Failure_Pressure_psi
    ##  N/A    : 62   N/A    : 62   L  : 79      Min.   :  677       
    ##  1.057  : 41   0.976  : 41   N/A: 73      1st Qu.: 1434       
    ##  1      : 18   0.634  : 17   R  :161      Median : 1844       
    ##  1.098  : 17   0.771  : 10                Mean   : 2252       
    ##  1.045  :  9   0.773  : 10                3rd Qu.: 2363       
    ##  1.048  :  9   0.834  :  9                Max.   :17999       
    ##  (Other):157   (Other):164                                    
    ##  Failure_Pressure_Mpa      SMYS            SMTS      
    ##  Min.   :  4.668      Min.   :172.0   Min.   :310.0  
    ##  1st Qu.:  9.887      1st Qu.:317.0   1st Qu.:434.0  
    ##  Median : 12.714      Median :359.0   Median :455.0  
    ##  Mean   : 15.525      Mean   :398.3   Mean   :505.1  
    ##  3rd Qu.: 16.292      3rd Qu.:448.0   3rd Qu.:531.0  
    ##  Max.   :124.099      Max.   :689.0   Max.   :757.0  
    ## 
    

    Prepare Dataset

    The main parameters needed for the analysis will be separated from the loaded data and into another set, the main parameters we need are:

    • Normalised length
    • Diameter to wall thickness ratio
    • Defects depth
    • Burst Pressure
    • SMYS
    • Failure Mode (for visualisation)
    Data <- data.frame(Norm_L = Burst_Tests_Data$Norm_Length, Depth = Burst_Tests_Data$d_by_WT, OD_by_WT = Burst_Tests_Data$OD_by_WT, SMYS = Burst_Tests_Data$SMYS, Test_P_Burst = Burst_Tests_Data$Failure_Pressure_Mpa, Failure_Mode=Burst_Tests_Data$Failure_Mode) 
    

    We can view all of the selected parameters using pairwise comparison on the basis of the failure mode.

    library(GGally)
    ggpairs(Data, mapping = aes(color = Failure_Mode))
    

    Next step is to partition our data into 2 sets, 90% for training and 10% for testing, these will be balanced splits based on the burst pressure values. The purpose of splitting the data is to allow the algorithms to learn the relationships between the parameters with the training set, followed by the testing set, which will be used as an independent set to make sure our trained model is not over-fitting the data during the training step.

    Split_Data <- createDataPartition(Data$Test_P_Burst, p = 0.90, list = FALSE)
    Training_Data <- Data[Split_Data,]
    Testing_Data <- Data[-Split_Data,]
    

    Train the Models

    There is a large list of machine learning algorithm supported by the caret package; however, for this analysis, I chose randomly 6 regression models, these are:

    • Model Tree
    • Support Vector Machines with Linear Kernel
    • Random Forest
    • k-Nearest Neighbors
    • Generalized Linear Model
    • Projection Pursuit Regression

    We will use repeated cross-validation which is a way to evaluate the performance of a model by randomly partitioning the training set into k equal size subsamples. Of the k subsamples, a single subsample is retained as the validation data for testing the model, and the remaining k-1 subsamples are used as training data. The cross-validation process is then repeated k times, for our analysis we will use 10 folds and 10 repeats.

    Each of the 6 models will be built using the function 'train()', the relationship between parameters will be expressed as follow:

    Purst Pressure = f(Normalised Length, Depth, OD/WT, SMYS)

    At the end, we will use the 10% testing data to predict the burst pressure for each trained model, using the function 'predict()'.

    train.control <- trainControl(method = "repeatedcv", number = 10, repeats = 10, verboseIter=FALSE)  
    Formula <- Test_P_Burst ~ Norm_L + Depth + OD_by_WT + SMYS
    Test_Data <- subset(Testing_Data , select = c("Norm_L", "Depth", "OD_by_WT", "SMYS"))
    
    # Model Rules 
    Model_MR <- train(Formula, data = Training_Data, method = "M5Rules", trControl = train.control, preProc = c("center", "scale"))
    Model_MR_P_Burst <- predict(Model_MR, Testing_Data)
    
    # Support Vector Machines with Linear Kernel
    Model_SVM <- train(Formula, data = Training_Data, method = "svmLinear", trControl = train.control, tuneGrid = expand.grid(C = c(0.01, 0.1, 0.5)), preProc = c("center", "scale"))
    Model_SVM_P_Burst <- predict(Model_SVM, Testing_Data)
    
    # Random Forest
    Model_RF <- train(Formula, data = Training_Data, method = "rf", trControl = train.control, ntree=200, preProc = c("center", "scale"))
    Model_RF_P_Burst <- predict(Model_RF, Testing_Data)
    
    # k-Nearest Neighbors
    Model_KNN <- train(Formula, data = Training_Data, method = "knn", trControl = train.control, tuneLength = 10, preProc = c("center", "scale"))
    Model_KNN_P_Burst <- predict(Model_KNN, Testing_Data)
    
    # Generalized Linear Model
    Model_GLM <- train(Formula, data = Training_Data, method = "glm", trControl = train.control, tuneLength = 10, preProc = c("center", "scale"))
    Model_GLM_P_Burst <- predict(Model_GLM, Testing_Data)
    
    # Projection Pursuit Regression
    Model_PPR <- train(Formula, data = Training_Data, method = "ppr", trControl = train.control, tuneLength = 10, preProc = c("center", "scale"))
    Model_PPR_P_Burst <- predict(Model_PPR, Testing_Data)
    
    Models <- resamples(list(MR = Model_MR, RF = Model_RF, SVM = Model_SVM, KNN = Model_KNN, GLM = Model_GLM, PRR = Model_PPR))
    

    Compare the Models

    Now we have trained and tested all of our 6 models, let's have a look at how each model performed. First plot of the predicted burst pressure Vs. the real burst pressure:

    library(ggthemes)
    Test_Failure_P <- Testing_Data$Test_P_Burst
    Markers <- geom_point(size=1.5, shape=6, color="black")
    Unity <- geom_abline(slope=1, intercept = 0, color="red", linetype="dashed",size=1)
    Bground <- theme(axis.title = element_text(face="bold", size=12), panel.background = element_rect(fill = 'lightsteelblue4'), panel.grid = element_line(colour="grey"), plot.background=element_rect(fill="grey95"))
    P1 <- ggplot(,aes(x = Test_Failure_P, y = Model_MR_P_Burst)) + Markers + Unity + Bground 
    P2 <- ggplot(,aes(x = Test_Failure_P, y = Model_SVM_P_Burst)) + Markers + Unity + Bground
    P3 <- ggplot(,aes(x = Test_Failure_P, y = Model_RF_P_Burst)) + Markers + Unity + Bground
    P4 <- ggplot(,aes(x = Test_Failure_P, y = Model_KNN_P_Burst)) + Markers + Unity + Bground
    P5 <- ggplot(,aes(x = Test_Failure_P, y = Model_GLM_P_Burst)) + Markers + Unity + Bground
    P6 <- ggplot(,aes(x = Test_Failure_P, y = Model_PPR_P_Burst)) + Markers + Unity + Bground
    grid.arrange(P1, P2, P3, P4, P5, P6, nrow=2)
    

    We can see that in overall, the Random Forest appears to be the most accurate model, however, performance is not totally that clear from the plots alone, for a clear comparison we can use some evaluation metrics, these can be viewed by calling the function summary().

    summary(Models)
    ## 
    ## Call:
    ## summary.resamples(object = Models)
    ## 
    ## Models: MR, RF, SVM, KNN, GLM, PRR 
    ## Number of resamples: 100 
    ## 
    ## MAE 
    ##         Min.  1st Qu.   Median     Mean  3rd Qu.      Max. NA's
    ## MR  1.249353 1.961890 2.341977 2.611588 3.200767  5.861817    0
    ## RF  1.023035 1.495052 1.728636 1.908296 2.125849  4.333484    0
    ## SVM 1.986233 2.777073 3.766255 4.289719 5.560249 10.508175    0
    ## KNN 1.133630 1.858979 2.138108 2.655981 3.050784  6.585347    0
    ## GLM 3.070781 4.524447 5.415050 5.652634 6.456241 10.905213    0
    ## PRR 1.167177 1.861359 2.260386 2.293145 2.678526  3.878608    0
    ## 
    ## RMSE 
    ##         Min.  1st Qu.   Median     Mean   3rd Qu.      Max. NA's
    ## MR  1.557999 2.623602 3.619572 4.472389  5.756353 14.857580    0
    ## RF  1.227453 2.092623 2.482315 3.415498  3.719935 11.558717    0
    ## SVM 2.487095 3.660816 8.935002 9.425596 16.255103 25.082527    0
    ## KNN 1.491673 2.677945 3.185990 5.282331  6.621437 20.164751    0
    ## GLM 3.721669 5.943858 7.765995 9.409684 12.624701 22.397631    0
    ## PRR 1.550538 2.596583 3.350004 3.793293  4.563330  9.107361    0
    ## 
    ## Rsquared 
    ##             Min.   1st Qu.    Median      Mean   3rd Qu.      Max. NA's
    ## MR  0.0002491479 0.8188490 0.8872148 0.8464541 0.9523463 0.9863039    0
    ## RF  0.7559770108 0.9101539 0.9545877 0.9344962 0.9787224 0.9939840    0
    ## SVM 0.2365625650 0.4314300 0.5670594 0.5446240 0.6590483 0.8127915    0
    ## KNN 0.5504808103 0.7854814 0.8823773 0.8547489 0.9483226 0.9844278    0
    ## GLM 0.3281077690 0.4974465 0.5495725 0.5538143 0.6003874 0.8050598    0
    ## PRR 0.6472502237 0.8316454 0.9302789 0.8939118 0.9687244 0.9913075    0
    

    We can also compare the accuracy of the models visually by using the dot plot.

    scales <- list(x=list(relation="free"), y=list(relation="free"))
    dotplot(Models, scales=scales, layout=c(3,1))
    

    It is clear from the above, Random Forst appears to be the optimal model in this analysis, now we can use it in a normal assessment.

    First let’s have a look how normal defect assessment method perform when compared to the test data (in this case I have selected the Modified ASME B31G method). For that, we create a function to calculate burst pressure of the defects used in the tests and add results to the parameters we selected previously.

    # Modified ASME B31G 
    P_Burst <- function(Norm_Length, d_by_WT, OD_by_WT, SMYS){
    if (Norm_Length <= 50^0.5) 
    {
        M <-  (1 + 0.6275*Norm_Length - 0.003375*Norm_Length^2)^0.5
    } else {
        M <-  0.032*Norm_Length + 3.3
    } 
    Sig_Flow <- SMYS + 69
    P <- (((2*Sig_Flow)/OD_by_WT )*(1-0.85*d_by_WT))/(1-((0.85*d_by_WT)/M))  
    return(P)
    }
    
    # Calculate burst pressure for test defects
    B31G_P_Burst <- c()
    for(i in 1:length(Burst_Tests_Data[,1])) 
    {
      B31G_P_Burst[i] <- P_Burst(Burst_Tests_Data$Norm_Length[i], Burst_Tests_Data$d_by_WT[i], Burst_Tests_Data$OD_by_WT[i], Burst_Tests_Data$SMYS[i])
    }
    
    # Add results to previous selection
    Data <- data.frame(Norm_L = Burst_Tests_Data$Norm_Length, Depth = Burst_Tests_Data$d_by_WT, OD_by_WT = Burst_Tests_Data$OD_by_WT, SMYS = Burst_Tests_Data$SMYS, Test_P_Burst = Burst_Tests_Data$Failure_Pressure_Mpa, B31G_P_Burst) 
    

    Let’s have a look how Modified B31G burst pressure results compare to tests results.

    P <- ggplot(Data, aes(x = Test_P_Burst, y = B31G_P_Burst))+ geom_point(size=1.6, shape=6, colour = "black")+
    labs(x = "Test Burst Pressure", y = "Modified B31G Burst Pressure") + 
    geom_abline(aes(slope=1, intercept = 0), linetype="dashed", size=1, colour = "red")+ 
    theme(panel.background = element_rect(fill = 'lightsteelblue4'), 
          axis.title = element_text(face="bold", size=12),
          plot.background=element_rect(fill="white"),
          axis.text = element_text(colour = "black", size=11))
    P + facet_zoom(x = Test_P_Burst < 40, y = B31G_P_Burst < 40, horizontal=F,zoom.size = 1)
    

    We can see that in overall, the Modified B31G tend to under-estimate the values of the burst pressure. Now let's have a practical test with a new data set, created randomly.

    Rep_Nb <- 500    # Random numbers to be genrated
    L <- runif(Rep_Nb, min=5, max=100)
    dt <- runif(Rep_Nb, min=0.1, max=0.7)
    OD <- rep(406.4, times=Rep_Nb)   
    SMYS <- rep(359, times=Rep_Nb)   
    WT <- runif(Rep_Nb, min=5, max=15)
    Norm_L <- L/(OD*WT)^0.5
    OD_by_WT <- OD/WT
    Depth <- dt
    
    # Now let's predict the burst pressure using the best performing model, i.e. neural networks.
    Pract_Test <- data.frame(Norm_L, Depth, OD_by_WT, SMYS)
    Pract_P_Burst <- predict(Model_RF, Pract_Test)
    
    # Estimate the burst pressure of the randomly generated parameters using Modified B31G
    B31G_P_Pract <- c()
    for(i in 1:Rep_Nb) 
    {
     B31G_P_Pract[i] <- P_Burst(Norm_L[i], Depth[i], OD_by_WT[i], SMYS[i])
    }
    ggplot(, aes(x = Pract_P_Burst, y = B31G_P_Pract))+ geom_point(size=1.6, shape=6, colour = "black")+
    labs(x = "Predicted Pressure", y = "Modified B31G Pressure") + 
    geom_abline(aes(slope=1, intercept = 0), linetype="dashed", size=1, colour = "red")+ 
    theme(panel.background = element_rect(fill = 'lightsteelblue4'), 
          axis.title = element_text(face="bold", size=12),
          plot.background=element_rect(fill="white"),
          axis.text = element_text(colour = "black", size=11))
    

    In The above guide we only limited the number of models to 6; however, we can include as many as we want for better selection. In the next post, I will be showing how to combine multiple models as an ensemble for better predictions.

    Related Post


    Earthquake Analysis (3/4): Visualizing Data on Maps

    $
    0
    0

    Category

    Tags

    This is the third part of our post series about the exploratory analysis of a publicly available dataset reporting earthquakes and similar events within a specific 30 days time span. In this post, we are going to show static, interactive and animated earthquakes maps of different flavors by using the functionalities provided by a pool of R packages as specifically explained herein below.

    For static maps:

    • ggplot2 package
    • tmap package
    • ggmap package

    For interactive maps:

    • leaflet package
    • tmap package
    • mapview package

    For animated maps:

    • animation package
    • gganimate package
    • tmap package

    Packages

    I am going to take advantage of the following packages.

    suppressPackageStartupMessages(library(ggplot2))
    suppressPackageStartupMessages(library(ggmap))
    suppressPackageStartupMessages(library(ggsn))
    suppressPackageStartupMessages(library(dplyr))
    suppressPackageStartupMessages(library(lubridate))
    suppressPackageStartupMessages(library(sf))
    suppressPackageStartupMessages(library(spData))
    suppressPackageStartupMessages(library(tmap))
    suppressPackageStartupMessages(library(leaflet))
    suppressPackageStartupMessages(library(mapview))
    suppressPackageStartupMessages(library(animation))
    suppressPackageStartupMessages(library(gganimate))
    suppressPackageStartupMessages(library(ggthemes))
    suppressPackageStartupMessages(library(gifski))
    suppressPackageStartupMessages(library(av))
    

    Packages versions are herein listed.

    packages <- c("ggplot2", "ggmap", "ggsn", "dplyr", "lubridate", "sf", "spData", "tmap", "leaflet", "mapview", "animation", "gganimate", "ggthemes", "gifski", "av")
    version <- lapply(packages, packageVersion)
    version_c <- do.call(c, version)
    data.frame(packages=packages, version = as.character(version_c))
    ##     packages version
    ## 1    ggplot2   3.1.0
    ## 2      ggmap   3.0.0
    ## 3       ggsn   0.5.0
    ## 4      dplyr 0.8.0.1
    ## 5  lubridate   1.7.4
    ## 6         sf   0.7.3
    ## 7     spData   0.3.0
    ## 8       tmap     2.2
    ## 9    leaflet   2.0.2
    ## 10   mapview   2.6.3
    ## 11 animation     2.6
    ## 12 gganimate   1.0.2
    ## 13  ggthemes   4.1.0
    ## 14    gifski   0.8.6
    ## 15        av     0.2
    

    Running on Windows-10 the following R language version.

    R.version
    ##                _                           
    ## platform       x86_64-w64-mingw32          
    ## arch           x86_64                      
    ## os             mingw32                     
    ## system         x86_64, mingw32             
    ## status                                     
    ## major          3                           
    ## minor          5.2                         
    ## year           2018                        
    ## month          12                          
    ## day            20                          
    ## svn rev        75870                       
    ## language       R                           
    ## version.string R version 3.5.2 (2018-12-20)
    ## nickname       Eggshell Igloo
    

    Getting Data

    As shown in the previous posts, we download the earthquake dataset from earthquake.usgs.gov, specifically the last 30 days dataset. Please note that such earthquake dataset is day by day updated to cover the last 30 days of data collection. Moreover, it is not the most recent dataset available as I collected it some weeks ago. The earthquakes dataset is in CSV format. If not yet present into our workspace, we download and save it. Then we load it into quakes local variable. .

    if ("all_week.csv" %in% dir(".") == FALSE) {
      url <- "https://earthquake.usgs.gov/earthquakes/feed/v1.0/summary/all_week.csv"
      download.file(url = url, destfile = "all_week.csv")
    }
    quakes <- read.csv("all_month.csv", header=TRUE, sep=',', stringsAsFactors = FALSE)
    
    quakes$time <- ymd_hms(quakes$time)
    quakes$updated <- ymd_hms(quakes$updated)
    
    quakes$magType <- as.factor(quakes$magType)
    quakes$net <- as.factor(quakes$net)
    quakes$type <- as.factor(quakes$type)
    quakes$status <- as.factor(quakes$status)
    quakes$locationSource <- as.factor(quakes$locationSource)
    quakes$magSource <- as.factor(quakes$magSource)
    quakes <- arrange(quakes, -row_number())
    
    # earthquakes dataset
    earthquakes <- quakes %>% filter(type == "earthquake")
    

    Static Maps

    We herein show three flavors of maps by taking advantage of the functionalities provided within the packages ggplot2, tmap and ggmap.

    gplot2 package

    Taking advantage of the ggplot2 package, we create a static map of the earthquake events. Here is the description of the steps to create such a map, numbering corresponds to the comments within the source code.

    1. we get the “world” data frame providing with data of world regions in a suitable way for plotting
    2. we set the title string of our map as based on the timeline start and end of our earthquakes dataset
    3. we create a ggplot object based on the geom_map() geometry in order to obtain polygons from a reference map
    4. we add to our ggplot object the points graphic objects (by geom_point()) as located where the earthquakes happened
    5. we add the title
    6. we add the compass as located to the bottom right of the map, adjusting further its location by the anchor parameter
    7. we add the scale bar as located to the bottom left, in km units and 2500 km minimum distance represented with WGS84 ellipsoid model
    #1
    world <- map_data('world')
    #2
    title <- paste("Earthquakes map from ", paste(as.Date(earthquakes$time[1]), as.Date(earthquakes$time[nrow(earthquakes)]), sep = " to "))
    #3
    p <- ggplot() + geom_map(data = world, map = world, aes(x = long, y=lat, group=group, map_id=region), fill="white", colour="#7f7f7f", size=0.5)
    #4
    p <- p + geom_point(data = earthquakes, aes(x=longitude, y = latitude, colour = mag)) + scale_colour_gradient(low = "#00AA00",high = "#FF00AA") 
    #5
    p <- p + ggtitle(title) 
    #6
    p <- p + ggsn::north(data = earthquakes, location = "bottomright", anchor = c("x"=200, "y"=-80), symbol = 15)
    #7
    p <- p + ggsn::scalebar(data=earthquakes, location = "bottomleft", dist = 2500, dist_unit = "km", transform = TRUE, model = "WGS84")
    p
    

    tmap package

    In this example, we take advantage of the tmap package. For the purpose, we instantiate a Simple Features object by taking advantage of the sf package. The Simple Features is an open standard developed and endorsed by the Open Geospatial Consortium (OGC), a not-for-profit organization. Simple Features is a hierarchical data model that represents a wide range of geometry types.

    Here is the description of the steps to create such a map, numbering corresponds to the comments within the source code.

    1. we set the WGS84 as a string projection that will be passed as input paramter to the function which will build our spatial object
    2. we set the title string
    3. we convert our earthquake dataset to a sf (simple features) object by st_as_sf() function within the sf package
    4. we create a tmap-element as based on the world Simple Features object as available within the spData package.
    5. we choose the classic style for out map and white colors with borders for regions
    6. we add the title
    7. we add the compass chossing the 8star type in the right+bottom position
    8. we add a scale bar 0-2500-5000 km in the left+bottom position
    9. we add the previously build Simple Features object at step #3
    10. we use the dot symbol to indicate earthquake events on the map with a color scale associated to the magnitude of the event
    #1
    projcrs <- "+proj=longlat +datum=WGS84 +no_defs +ellps=WGS84 +towgs84=0,0,0"
    #2
    title <- paste("Earthquakes map from ", paste(as.Date(earthquakes$time[1]), as.Date(earthquakes$time[nrow(earthquakes)]), sep = " to "))
    #3
    df <- st_as_sf(x = earthquakes, coords = c("longitude", "latitude"), crs = projcrs)
    #4
    p <- tm_shape(spData::world) 
    #5
    p <- p + tm_style("classic") + tm_fill(col = "white")  + tm_borders() 
    #6  
    p <- p + tm_layout(main.title = title) 
    #7
    p <- p + tm_compass(type = "8star", position = c("right", "bottom")) 
    #8
    p <- p + tm_scale_bar(breaks = c(0, 2500, 5000), size = 1, position = c("left", "bottom")) 
    #9
    p <- p + tm_shape(df) 
    #10
    p <- p + tm_dots(size = 0.1, col = "mag", palette = "YlOrRd")
    p
    ## Scale bar set for latitude km and will be different at the top and bottom of the map.
    

    Before introducing further map flavors, we take some time to show an overview of how the typical problem of creating a map for a specific region and related data can be fulfilled. Specifically, let us suppose we would like to draw the California map showing earthquakes occurred on such a geographical region. The quick&dirty approach could be to find out interval ranges for longitude and latitude in order to determine a rectangular geographical region which contains the California boundaries. Something depicted in the source code herein below whose steps are so described.

    1. we obtain a new dataset starting from the earthquakes one by filtering on specific longitude and latitude intervals
    2. we get the California map by filtering the California state map from the United States map made available by the spData package
    3. we convert our california dataset to a sf (simple features) object by st_as_sf() function within the sf package
    4. we create a tmap-element as based on California map; such tmap-element instance specifies a spatial data object using the world Simple Features object as available within the spData package.
    5. we choose the classic style for out map and pale green color fill color with borders for regions
    6. we set the title onto the map
    7. we add the compass chossing the 8star type in the right+top position
    8. we add a scale bar 0-100-200 km in the left+bottom position
    9. we add the previously build Simple Features object as based on the earthquake dataset
    10. we use the dot symbol to indicate earthquake events on the map with a color scale associated with the magnitude of the event
    #1
    california_data <- earthquakes %>% filter(longitude >= -125 & longitude <= -114 & latitude <= 42.5 & latitude >= 32.5)
    #2
    map_california <- us_states %>% filter(NAME == "California")
    #3
    df <- st_as_sf(x = california_data, coords = c("longitude", "latitude"), crs = st_crs(map_california))
    #4
    p <- tm_shape(map_california) 
    #5
    p <- p + tm_style("classic") + tm_fill(col = "palegreen4") + tm_borders() 
    #6  
    p <- p + tm_layout(main.title = paste("California earthquakes map from ", paste(as.Date(california_data$time[1]), as.Date(california_data$time[nrow(california_data)]), sep = " to "))) 
    #7
    p <- p + tm_compass(type = "8star", position = c("right", "top")) 
    #8
    p <- p + tm_scale_bar(breaks = c(0, 100, 200), size = 1, position = c("left", "bottom")) 
    #9
    p <- p + tm_shape(df) 
    #10
    p <- p + tm_dots(size = 0.1, col = "mag", palette = "YlOrRd")
    p
    

    A better result can be achieved by first doing an inner join between our earthquake dataset and the map of California so to determine exactly what are the earthquakes within the California boundaries. Here are the steps to do it.

    1. we convert our earthquakes dataset to a sf (simple features) object by st_as_sf() function within the sf package
    2. we inner join (left = FALSE) our simple features object with the California map; that gives a new simple features object providing with earthquakes occurred exactly within California geographical boundaries
    3. we create a tmap-element as based on California map; such tmap-element instance specifies a spatial data object using the world Simple Features object as available within the spData package.
    4. we choose the classic style for out map and pale green color fill color with borders for regions
    5. we set the title onto the map
    6. we add the compass chossing the 8star type in the right+top position
    7. we add a scale bar 0-100-200 km in the left+bottom position
    8. we add the previously build Simple Features object resulting from the inner join at step #2
    9. we use the dot symbol to indicate earthquake events on the map with a color scale associated with the magnitude of the event
    #1
    df <- st_as_sf(x = earthquakes, coords = c("longitude", "latitude"), crs = st_crs(map_california))
    
    #2
    df_map_inner_join <- st_join(df, map_california, left=FALSE)
    ## although coordinates are longitude/latitude, st_intersects assumes that they are planar
    
    #3
    p <- tm_shape(map_california)
    #4
    p <- p + tm_style("classic") + tm_fill(col = "palegreen4") + tm_borders() 
    #5
    p <- p + tm_layout(main.title = paste("California earthquakes map from ", paste(as.Date(california_data$time[1]), as.Date(california_data$time[nrow(california_data)]), sep = " to "))) 
    #6
    p <- p + tm_compass(type = "8star", position = c("right", "top")) 
    #7
    p <- p + tm_scale_bar(breaks = c(0, 100, 200), size = 1, position = c("left", "bottom"))
    #8
    p <- p + tm_shape(df_map_inner_join) 
    #9
    p <- p + tm_dots(size = 0.1, col = "mag", palette = "YlOrRd")
    p
    

    ggmap package

    We show a static map as obtained by taking advantage of the qmplot() function within the ggmap package.

    So, we draw a map where symbols highlighting magnitude (color) and different point symbols associated to the event type. The qmplot() function is the “ggmap” equivalent to the ggplot2 package function qplot() and allows for the quick plotting of maps with data. The stamen map flavor is used.

    title <- paste("Earthquakes map from ", paste(as.Date(earthquakes$time[1]), as.Date(earthquakes$time[nrow(earthquakes)]), sep = " to "))
    
    magnitude <- factor(round(earthquakes$mag))
    
    suppressMessages(qmplot(x = longitude, y = latitude, data = earthquakes, geom = "point", colour = magnitude, source = "stamen", zoom = 3) + scale_color_brewer(palette = 8) + ggtitle(title))
    

    Interactive Maps

    An interactive map offers result which depends upon the mouse click actions on the map itself. For example, showing a pop-up with some data when the user clicks on the specific symbol to indicate the location of the earthquake event for our scenario. Unfortunately, the interaction with the map cannot result when embedding it into DS+ site posts, you have to try it out by yourself taking advantage of the following source code. This is true for all the examples we are going to show.

    leaflet package

    The leaflet package provides with functionalities to create and customize interactive maps using the Leaflet JavaScript library and the htmlwidgets package. These maps can be used directly from the R console, from 'RStudio', in Shiny applications and R Markdown documents. Here is an example where a pop-up is defined to provide with the place, identifier, time, magnitude and depth data. Further, the cluster options eases the user experience by means of a hierarchical representation in terms of clusters that incrementally show up. Here is what we can get.

    earthquakes %>% leaflet() %>% addTiles() %>% 
      addMarkers(~longitude, ~latitude,
                 popup = (paste("Place: ", earthquakes$place, "<br>", 
                                "Id: ", earthquakes$id, "<br>",
                                "Time: ", earthquakes$time, "<br>",
                                "Magnitude: ", earthquakes$mag, " m <br>",
                                "Depth: ", earthquakes$depth)),
                 clusterOptions = markerClusterOptions())
    

    tmap package

    We take advantage of the tmap package again, however this time for an interactive map which can be easily created based previously shown source code for the same package when the tmap mode view is set. Here are the steps to generate such map.

    1. we set the WGS84 as a string projection that will be passed as input paramter to the function which will build our spatial object
    2. we set the title string
    3. we convert our starting earthquake dataset to a sf (simple features) object by st_as_sf() function within the sf package
    4. we set the tmap_mode equal to “view” to allow for animation (the default is “plot”)
    5. we create a tmap-element as based on the world Simple Features object as available within the spData package.
    6. we choose the classic style for out map and white colors with borders for regions
    7. we add the title
    8. since the compass is not supported in view mode, we comment such line of code previously used for static maps
    9. we add a scale bar 0-2500-5000 km in the left+bottom position
    10. we add the previously build Simple Features object at step #3
    11. we use the dot symbol to indicate earthquake events on the map with a color scale associated with the magnitude of the event
    #1
    projcrs <- "+proj=longlat +datum=WGS84 +no_defs +ellps=WGS84 +towgs84=0,0,0"
    #2
    title <- paste("Earthquakes map from ", paste(as.Date(earthquakes$time[1]), as.Date(earthquakes$time[nrow(earthquakes)]), sep = " to "))
    #3
    df <- st_as_sf(x = earthquakes, coords = c("longitude", "latitude"), crs = projcrs)
    #4
    tmap_mode("view")
    ## tmap mode set to interactive viewing
    
    #5
    p <- tm_shape(spData::world) 
    #6
    p <- p + tm_style("classic") + tm_fill(col = "white")  + tm_borders() 
    #7
    p <- p + tm_layout(main.title = title) 
    #8 compass is not supported in view mode
    #p <- p + tm_compass(type = "8star", position = c("right", "bottom")) 
    #9
    p <- p + tm_scale_bar(breaks = c(0, 2500, 5000), size = 1, position = c("left", "bottom")) 
    #10
    p <- p + tm_shape(df) 
    #11
    p <- p + tm_dots(size = 0.01, col = "mag", palette = "YlOrRd")
    p
    

    We set the mode to “plot” so to revert back to the static map flavor.

    tmap_mode("plot")
    ## tmap mode set to plotting
    

    mapview package

    We show an interactive map as obtained by taking advantage of the mapview package. Here are the steps.

    1. we set the WGS84 as a string projection that will be passed as input parameter to the function which will build our spatial object
    2. we set the title string
    3. we convert our starting earthquake dataset to a sf (simple features) object by st_as_sf() function within the sf package
    4. we create a palette by using the colorRampPalette, a function that gives a fixed number of colors to interpolate the resulting palette with
    5. we create the interactive map of CartoDB.Positron flavor with popups showing place and magnitude; we control the size of the dot by the cex parameter; we choose to interpolate on 12 colors scale starting from the palette created at step #4
    #1
    projcrs <- "+proj=longlat +datum=WGS84 +no_defs +ellps=WGS84 +towgs84=0,0,0"
    #2
    title <- paste("Earthquakes map from ", paste(earthquakes$time[1], earthquakes$time[nrow(earthquakes)], sep = " to "))
    #3
    df <- st_as_sf(x = earthquakes, coords = c("longitude", "latitude"), crs = projcrs)
    #4
    pal <- colorRampPalette(c("green", "yellow", "red", "violet"))
    #5
    mapview(df, popup = popupTable(df, zcol = c("place", "mag")), zcol = "mag", legend = TRUE, map.types = c("CartoDB.Positron"), cex= 4, alpha = 0.3, col.regions = pal(12))
    

    As map flavor, you can choose among CartoDB.Positron, CartoDB.DarkMatter, OpenStreetMap, Esri.WorldImagery, OpenTopoMap.

    Animated Maps

    We would like to create an animated map showing day by day the location of the events. We then show different implementations for achieving such a goal.

    animation package

    We herein show how to create an animated GIF by means of the animation package. Also the option to generate a short video in “avi” the format is outlined. Here are the steps to do it.

    1. we determine the days’ array to be displayed on the map
    2. we determine how many picture generate, which is equal to the days timespan
    3. we define a custom color vector of colors name strings
    4. we determine the box area to be used for map display; that is useful for avoiding an annoying map resizing effect from frame to frame during the resulting animation
    5. we get the map of stamen flavor and terrain type
    6. we save the GIF resulting from a loop of maps plot where:
    • we get the earthquake day
    • we filter the earthquake dataset to find the events associated to the day of step 6.1
    • we translate the earthquake magnitude to a new factor variable
    • we create the map by ggmap()
    • we use point geometries to highlight where the earthquake happened
    • we use a color scale custom defined as based on the colors vector defined at step #3
    • we add the map title
    • we plot the resulting map
    • we set as animation options:
      – time interval of the animation to 1
      – maximum number of steps for each loop equal to 1
      – map width and heigth both equal to 1000 pixels
      – resulting animated GIF file name
    #1
    days <- unique(as.Date(earthquakes$time))
    #2
    l <- length(days)
    #3
    cols <- c( "-1" = "grey", "0" = "darkgrey", "1" = "green", "2" = "blue", "3" = "yellow", "4" = "pink", "5" = "orange", "6" = "red", "7" = "violet", "8" = "black", "NA" = "white")
    #4
    bbox <- make_bbox(lon = c(-180, 180), lat = c(-70,70), f = 0)
    #5
    map <- get_map(location = bbox, zoom = 3, source = "stamen", maptype = "terrain", force = FALSE)
    #6
    saveGIF( {
      for (i in 1:l) {
        #6.1
        the_day <- days[i]
        #6.2
        earthquakes_of_day <- earthquakes %>% filter(as.Date(time) == the_day)
        #6.3
        magnitude <- factor(round(earthquakes_of_day$mag))
        #6.4
        p <- ggmap(map) 
        #6.5
        p <- p + geom_point(data = earthquakes_of_day, aes(x=longitude, y=latitude, color = magnitude))
        #6.6
        p <- p + scale_colour_manual(values = cols) 
        #6.7
        p <- p + ggtitle(the_day)
        #6.8
        plot(p)
      }
       #6.9
    }, interval = 1, nmax = l, ani.width = 1000, ani.height = 1000, movie.name = "earthquakes1.gif")
    

    Please click on the picture below to see its animation

    gganimate package

    Another way to create an animated GIF, is to leverage on the animate() function of the gganimate package. Here are the steps to do it.

    1. we determine the days’ array to be displayed on the map
    2. we determine the number of frames to be generated for our video, as equal to the number of days our dataset reports
    3. we determine the days array to be displayed on the map
    4. we translate the earthquake magnitude to a new factor variable
    5. we define a custom color vector of colors name strings
    6. we first create the world map showing regions with borders and fill gray colors
    7. we highlight the earthquake events on the map by means of point geometry with point colors based on the magnitude; the cumulative flag allows for building up an object or path over time
    8. we set our custom color scale as defined at step #5
    9. we add a label showing the day associated to the currently displayed frame within the resulting animation
    10. we define the frame-to-frame transition variable as the earthquake event day
    11. we set the fade effect to be applied to the frame visualization sequence
    12. we set the animation options specifying the image size in pixel units
    13. we generate the animation specifying its frames length equal to the number of days and the resulting animated GIF file name
    #1
    days <- unique(as.Date(earthquakes$time))
    #2
    l <- length(days)
    #3
    earthquakes$date <- as.Date(earthquakes$time)
    #4
    magnitude <- factor(round(earthquakes$mag))
    #5
    cols <- c( "-1" = "grey", "0" = "darkgrey", "1" = "green", "2" = "blue", "3" = "yellow", "4" = "pink", "5" = "orange", "6" = "red", "7" = "violet", "8" = "black", "NA" = "white")
    #6
    map <- ggplot() + borders("world", colour = "gray65", fill = "gray60") + theme_map() 
    #7
    map <- map + geom_point(aes(x = longitude, y = latitude, colour = magnitude, frame = date, cumulative = TRUE), data = earthquakes)
    #8
    map <- map + scale_colour_manual(values = cols) 
    #9
    map <- map + geom_text(data = earthquakes, aes(-100, 100, label=date)) 
    #10
    map <- map + transition_time(date) 
    #11
    map <- map + enter_fade() + exit_fade()
    #12
    options(gganimate.dev_args = list(width = 1000, height = 600))
    #13
    suppressMessages(animate(map, nframes = l, duration = l, renderer = gifski_renderer("earthquakes2.gif")))
    ## 
    Frame 1 (3%)
    Frame 2 (6%)
    Frame 3 (9%)
    Frame 4 (12%)
    Frame 5 (16%)
    Frame 6 (19%)
    Frame 7 (22%)
    Frame 8 (25%)
    Frame 9 (29%)
    Frame 10 (32%)
    Frame 11 (35%)
    Frame 12 (38%)
    Frame 13 (41%)
    Frame 14 (45%)
    Frame 15 (48%)
    Frame 16 (51%)
    Frame 17 (54%)
    Frame 18 (58%)
    Frame 19 (61%)
    Frame 20 (64%)
    Frame 21 (67%)
    Frame 22 (70%)
    Frame 23 (74%)
    Frame 24 (77%)
    Frame 25 (80%)
    Frame 26 (83%)
    Frame 27 (87%)
    Frame 28 (90%)
    Frame 29 (93%)
    Frame 30 (96%)
    Frame 31 (100%)
    ## Finalizing encoding... done!
    

    Please click on the picture below to see its animation

    If you like to produce your animation in avi format, change the renderer as herein shown.

    animate(map, nframes= 31, duration = 31, renderer = av_renderer("earthquakes2.avi"))
    

    tmap package

    The tmap package provides with the function tmap_animation() to create animated maps. Here are the steps to do it.

    1. we create a new column data named as date inside our earthquake dataset
    2. we convert our starting earthquake dataset to a sf (simple features) object by st_as_sf() function within the sf package
    3. we create a tmap-element as based on the world Simple Features object as available within the spData package.
    4. we choose the classic style for out map and the gray fill color with borders for regions
    5. we add the compass chossing the 8star type in the right+bottom position
    6. we add a scale bar 0-2500-5000 km in the left+bottom position
    7. we add the previously build Simple Features object at step #3
    8. we use the dot symbol to indicate earthquake events on the map with a color scale associated with the magnitude of the event
    9. we define facets as based on the earthquake event date
    10. we save the result in a variable to be used later
    #1
    earthquakes$date <- as.Date(earthquakes$time)
    #2
    df <- st_as_sf(x = earthquakes, coords = c("longitude", "latitude"), crs=st_crs(spData::world))
    #3
    p <- tm_shape(spData::world) 
    #4
    p <- p + tm_style("classic") + tm_fill(col = "gray") + tm_borders() 
    #5
    p <- p + tm_compass(type = "8star", position = c("right", "top")) 
    #6
    p <- p + tm_scale_bar(breaks = c(0, 2500, 5000), size = 1, position = c("left", "bottom")) 
    #7
    p <- p + tm_shape(df) 
    #8
    p <- p + tm_dots(size=0.2, col="mag", palette = "YlOrRd") 
    #9
    p <- p + tm_facets(along = "date", free.coords = TRUE)
    #10
    maps_result_for_anim <- p
    

    Finally, the animated map is produced by means of the tmap_animation() function.

    tmap_animation(maps_result_for_anim, filename = "earthquakes3.gif", delay = 100)
    

    Please click on the picture below to see its animation

    If you like to read more about maps visualization with R, take a look at the references list below.

    If you have any questions, please feel free to comment below.

    References

    1. Earthquake dataset
    2. Eathquake dataset terms
    3. ggmap: spatial visualization with ggplot2
    4. Geocomputation with R, Robin Lovelace, Jakub Nowosad, Jannes Muenchow, CRC press
    5. WGS 84
    6. Simple Features Standard
    7. Stamen maps
    8. Leaflet for R
    9. mapview options
    10. gganimate package
    11. Exploratory Data Analysis with R, Roger D. Peng

    Related Post

    A novel approach to visualize the categorical data in R

    $
    0
    0

    Category

    Tags

    Recently, I came across to the ggalluvial package in R. This package is particularly used to visualize the categorical data. As usual, I will use it with medical data from NHANES. Ggalluvial is a great choice when visualizing more than two variables within the same plot.

    First let's load the libraries we need:

    library(tidyverse)
    library(RNHANES)
    library(ggalluvial)
    library(ggsci)
    

    I used the NHANES data from 2009-2010 to see how the diabetes mellitus lies among the overall population in the US. Below, I did data cleaning and wrangling.

    dat = nhanes_load_data("DEMO_F", "2009-2010") %>%
      select(SEQN, RIAGENDR, RIDRETH1) %>%
      left_join(nhanes_load_data("DIQ_F", "2009-2010"), by="SEQN") %>%
      select(SEQN, RIAGENDR, RIDRETH1, DIQ010) %>% 
      left_join(nhanes_load_data("BMX_F", "2009-2010"), by="SEQN") %>% 
      select(SEQN, RIAGENDR, RIDRETH1, DIQ010, BMXBMI) %>% 
      mutate(
        gender = recode_factor(RIAGENDR, 
                               `1` = "Males", 
                               `2` = "Females"),
         race = recode_factor(RIDRETH1, 
                             `1` = "Hispanic", 
                             `2` = "Hispanic", 
                             `3` = "White", 
                             `4` = "Black", 
                             `5` = "Others"), 
        diabetes = recode_factor(DIQ010,  
                               `1` = "Yes", 
                               `2` = "No"),
        BMI = if_else(BMXBMI >= 25, "Overweight", "Normal weight")) %>% 
      filter(!is.na(diabetes), race != "Others", !is.na(BMI))
    

    After having a final dataset 'dat,' I will 'group_by' variables of interest and get the frequency of the combined data. This information will be shown in y-axis of the plot.

    dt = dat %>% 
      group_by(race, gender, BMI, diabetes) %>% 
      summarise(N = n())
    

    Applying the new 'dt' created gives the diagram below:

    ggplot(data = dt,
           aes(axis1 = race, axis2 = gender, axis3 = diabetes,
               y = N)) +
      scale_x_discrete(limits = c("race", "gender", "diabetes"), expand = c(.1, .05)) +
      geom_alluvium(aes(fill = BMI)) +
      geom_stratum() + geom_text(stat = "stratum", label.strata = TRUE) +
      theme_minimal() +
      scale_fill_jama() +
      theme(legend.position="bottom") +
      labs( y = "No. individuals", title = "Diabetes in overall population in US 2009-2010",
              subtitle = "stratified by race, gender and diabetes mellitus", caption = "datascienceplus.com")
    

    This diagram shows that about 50% of people with diabetes are females, and as expected, most of them are overweight. The contribution of the race to the prevalence of diabetes is equal, so no major race differences are found.

    Feel free to comment/suggest.

    Related Post

    Linear Regression with Healthcare Data for Beginners in R

    $
    0
    0

    Category

    Tags

    In this post I will show how to build a linear regression model. As an example, for this post, I will evaluate the association between vitamin D and calcium in the blood, given that the variable of interest (i.e., calcium levels) is continuous and the linear regression analysis must be used. I will also construct multivariable-adjusted models to account for confounders.

    Let's start loading the packages:

    library(tidyverse)
    library(RNHANES)
    library(ggplot2)
    

    Variables selected for this analysis include age, sex, plasma levels of vitamin D, and plasma levels of calcium. All variables are assessed from NHANES 2007 to 2010 wave.

    d07 = nhanes_load_data("DEMO_E", "2007-2008") %>%
      select(SEQN, cycle, RIAGENDR, RIDAGEYR) %>%
      transmute(SEQN=SEQN, wave=cycle, RIAGENDR, RIDAGEYR) %>% 
      left_join(nhanes_load_data("VID_E", "2007-2008"), by="SEQN") %>%
      select(SEQN, wave, RIAGENDR, RIDAGEYR, LBXVIDMS) %>% 
      transmute(SEQN, wave, RIAGENDR, RIDAGEYR, vitD=LBXVIDMS) %>% 
      left_join(nhanes_load_data("BIOPRO_E", "2007-2008"), by="SEQN") %>%
      select(SEQN, wave, RIAGENDR, RIDAGEYR, vitD, LBXSCA) %>% 
      transmute(SEQN, wave, RIAGENDR, RIDAGEYR, vitD, Calcium = LBXSCA)
    
    d09 = nhanes_load_data("DEMO_F", "2009-2010") %>%
      select(SEQN, cycle, RIAGENDR, RIDAGEYR) %>%
      transmute(SEQN=SEQN, wave=cycle, RIAGENDR, RIDAGEYR) %>% 
      left_join(nhanes_load_data("VID_F", "2009-2010"), by="SEQN") %>%
      select(SEQN, wave, RIAGENDR, RIDAGEYR, LBXVIDMS) %>% 
      transmute(SEQN, wave, RIAGENDR, RIDAGEYR, vitD=LBXVIDMS) %>% 
      left_join(nhanes_load_data("BIOPRO_F", "2009-2010"), by="SEQN") %>%
      select(SEQN, wave, RIAGENDR, RIDAGEYR, vitD,  LBXSCA) %>% 
      transmute(SEQN, wave, RIAGENDR, RIDAGEYR, vitD, Calcium = LBXSCA)
    
    dat = rbind(d07, d09)
    
    all = dat %>% 
      # exclude missings
      filter(!is.na(vitD), !is.na(Calcium)) %>% 
      mutate(Gender = recode_factor(RIAGENDR, 
                               `1` = "Males", 
                               `2` = "Females"))
    
    head(all)
    ##    SEQN      wave RIAGENDR RIDAGEYR vitD Calcium  Gender
    ## 1 41475 2007-2008        2       62 58.8     9.5 Females
    ## 2 41477 2007-2008        1       71 81.8    10.0   Males
    ## 3 41479 2007-2008        1       52 78.4     9.0   Males
    ## 4 41482 2007-2008        1       64 61.9     9.1   Males
    ## 5 41483 2007-2008        1       66 53.3     8.9   Males
    ## 6 41485 2007-2008        2       30 39.1     9.3 Females
    

    The dataset is complete. Before running the regression analysis, the linear model, I will check the assumption, that the distribution of the dependent variable (levels of calcium) is normal.

    Distribution of calcium level:

    ggplot(data = all) + 
      geom_histogram(aes(Calcium), binwidth = 0.2)
    

    It is a normal distribution.

    Note: If the distribution is not normal, the dependant variable should be log transform by using log(Calcium).

    The model

    I will use the function lm() to create a linear regression model. In the first model I will not adjust for confunders, insted, I will do a univariate model.

    fit1 <- lm(Calcium ~ vitD, data = all)
    

    Now, I will plot the distribution of residuals to check for normality.

    hist(residuals(fit1))
    

    It is normally distributed.

    To see the results, estimates, pvalues etc use summary function.

    summary(fit1)
    ## 
    ## Call:
    ## lm(formula = Calcium ~ vitD, data = all)
    ## 
    ## Residuals:
    ##      Min       1Q   Median       3Q      Max 
    ## -2.51254 -0.23398 -0.00581  0.22943  2.64876 
    ## 
    ## Coefficients:
    ##              Estimate Std. Error t value Pr(>|t|)    
    ## (Intercept) 9.3517792  0.0087769 1065.50   <2e-16 ***
    ## vitD        0.0016522  0.0001315   12.56   <2e-16 ***
    ## ---
    ## Signif. codes:  0 '***' 0.001 '**' 0.01 '*' 0.05 '.' 0.1 ' ' 1
    ## 
    ## Residual standard error: 0.3683 on 12389 degrees of freedom
    ## Multiple R-squared:  0.01258,    Adjusted R-squared:  0.0125 
    ## F-statistic: 157.8 on 1 and 12389 DF,  p-value: < 2.2e-16
    

    The 95% confidence interval:

    confint(fit1)
    ##                   2.5 %      97.5 %
    ## (Intercept) 9.334575125 9.368983370
    ## vitD        0.001394404 0.001910026
    

    Intepretation

    From the results, I find that vitamin D is associated with calcium in the blood because the p-value is less than 0.05. Next, I see the direction of the association. The positive beta estimate (\(\beta\) = 0.0016) indicate that with increasing vitamin D in the blood, the levels of calcium also increases.

    To visualize this association I will use the ggplot and the function geom_smooth. See below:

    ggplot(all, aes(x = vitD, y = Calcium)) +
                geom_point() +
                geom_smooth(method="lm")
    

    The plot shows an increase of the levels of Calcium with the increase of vitamin D in the blood.

    Multivariable adjusted models

    Often, a significant association could be explained by confounders. According to Wikipedia, a confounder is a variable that influences both the dependent variable and independent variable, causing a spurious association. Therefore, it is important to adjust for major confounders such as age and gender. The levels of vitamin D in the blood are dependent to age because older adults have lower vitamin D in blood compared to young adults.

    To conduct a multivariable-adjusted model I add other variables to the model, in this example, I will add age and gender.

    fit2 <- lm(Calcium ~ vitD + Gender + RIDAGEYR, data = all)
    summary(fit2)
    ## 
    ## Call:
    ## lm(formula = Calcium ~ vitD + Gender + RIDAGEYR, data = all)
    ## 
    ## Residuals:
    ##      Min       1Q   Median       3Q      Max 
    ## -2.50114 -0.22824 -0.00857  0.22354  2.69352 
    ## 
    ## Coefficients:
    ##                 Estimate Std. Error t value Pr(>|t|)    
    ## (Intercept)    9.4686333  0.0109933 861.307   <2e-16 ***
    ## vitD           0.0019034  0.0001310  14.526   <2e-16 ***
    ## GenderFemales -0.0653111  0.0065383  -9.989   <2e-16 ***
    ## RIDAGEYR      -0.0022455  0.0001581 -14.204   <2e-16 ***
    ## ---
    ## Signif. codes:  0 '***' 0.001 '**' 0.01 '*' 0.05 '.' 0.1 ' ' 1
    ## 
    ## Residual standard error: 0.3639 on 12387 degrees of freedom
    ## Multiple R-squared:  0.03619,    Adjusted R-squared:  0.03596 
    ## F-statistic: 155.1 on 3 and 12387 DF,  p-value: < 2.2e-16
    

    The association between vitamin D and calcium remained significant after adjustment, suggesting that the association is independent (e.g., not explained) by age and gender.

    Stratifing analysis

    To evaluate the association separately in men and women is necessary to conduct a stratified analysis. For this, I need to separate men and women into two different datasets and run linear regression for each group.

    allfem = all %>% 
      filter(Gender == "Females")
    allmal = all %>% 
      filter(Gender == "Males")
    

    Linear regression in women and men

    fitfem <- lm(Calcium ~ vitD + RIDAGEYR, data = allfem)
    summary(fitfem)
    ## 
    ## Call:
    ## lm(formula = Calcium ~ vitD + RIDAGEYR, data = allfem)
    ## 
    ## Residuals:
    ##      Min       1Q   Median       3Q      Max 
    ## -2.03557 -0.24115 -0.01084  0.22396  2.61555 
    ## 
    ## Coefficients:
    ##              Estimate Std. Error t value Pr(>|t|)    
    ## (Intercept) 9.2764092  0.0145412 637.940   <2e-16 ***
    ## vitD        0.0019577  0.0001729  11.321   <2e-16 ***
    ## RIDAGEYR    0.0005348  0.0002307   2.318   0.0205 *  
    ## ---
    ## Signif. codes:  0 '***' 0.001 '**' 0.01 '*' 0.05 '.' 0.1 ' ' 1
    ## 
    ## Residual standard error: 0.3727 on 6254 degrees of freedom
    ## Multiple R-squared:  0.02247,    Adjusted R-squared:  0.02216 
    ## F-statistic: 71.89 on 2 and 6254 DF,  p-value: < 2.2e-16
    
    fitmal <- lm(Calcium ~ vitD + RIDAGEYR, data = allmal)
    summary(fitmal)
    ## 
    ## Call:
    ## lm(formula = Calcium ~ vitD + RIDAGEYR, data = allmal)
    ## 
    ## Residuals:
    ##      Min       1Q   Median       3Q      Max 
    ## -2.42787 -0.21555 -0.00506  0.21384  2.70896 
    ## 
    ## Coefficients:
    ##               Estimate Std. Error t value Pr(>|t|)    
    ## (Intercept)  9.6027158  0.0150801  636.78   <2e-16 ***
    ## vitD         0.0016591  0.0001973    8.41   <2e-16 ***
    ## RIDAGEYR    -0.0049452  0.0002105  -23.49   <2e-16 ***
    ## ---
    ## Signif. codes:  0 '***' 0.001 '**' 0.01 '*' 0.05 '.' 0.1 ' ' 1
    ## 
    ## Residual standard error: 0.3451 on 6131 degrees of freedom
    ## Multiple R-squared:  0.08713,    Adjusted R-squared:  0.08684 
    ## F-statistic: 292.6 on 2 and 6131 DF,  p-value: < 2.2e-16
    

    The interpretation of results should be as above.

    Thats all.

    Related Post

    Find Insights with Ranked Cross-Correlations

    $
    0
    0

    Category

    Tags

    A well-done correlation analysis will lead us to a greater understanding of our data and empower us with valuable insights. A correlation analysis is a statistical technique that can show whether and how strongly pairs of variables are related, but all features must be numerical. Usually, we have numerous categorical variables in our data, that contains valuable information which might be hard to catch without a correlation analysis. So, is there an alternative or mathematical trick for us to use our data as it is and discover high correlation variables/values?

    Correlations

    Correlation works for quantifiable data in which numbers are meaningful, thus it cannot be calculated with categorical data such as gender, cities, or brands. These correlation coefficients might take values in the range of -1 to 1 (or -100% to 100%). It represents how closely the two variables are related: if this value is close to 0, it means that there is no relationship between the variables. When the value is positive, it means that as one variable gets larger the other gets larger. And, if they are negative it means that as one gets larger, the other gets smaller (often called an “inverse” correlation).

    For the following examples, we will be using the lares library and dplyr’s Star Wars dataset. To install the former, run the following in your R session. It might take a while the first time you install it; if updating, just a few seconds.

    devtools::install_github("laresbernardo/lares")
    

    Ranked Cross-Correlations

    I am sure there must be another academic name for this specific kind of analysis, but as I haven’t found it out there yet, that is how I’ve been addressing it. Basically, it is the result of a sorted long-format correlation matrix from a dataset which may contain dates and other categorical features, that has been transformed with one-hot encoding and some additional features creations.

    There are other authors who have done similar functions such as Alastair Rushworth with his inspectdf::inspect_cor() and Matt Dancho with correlationfunnel:: plot_correlation_funnel(). Both are great but are not exactly what I imagined and needed. So that’s why corr_cross() exists!

    Ranked Cross-Correlations not only explains relationships of a specific target feature with the rest but the relationship of all values in your data in an easy to use and understand tabular format. It automatically converts categorical columns into numerical with one hot encoding (1s and 0s) and other smart groupings such as “others” labels for not very frequent values and new features out of date features.

    OHSE (One Hot Smart Encoding) under the hood

    One way to go around this issue is to study the correlation of a specific value in a categorical feature with the rest of numerical columns, but that wouldn’t be enough; we are losing too much information from other variables. Another solution could be to apply dummy variables or one-hot-encoding to every categorical value, but we will probably get thousands of columns and it may be a problem. Maybe, we could get the n most frequent values for each categorical feature and group the rest in a single column. We could also create new features out of date values such as weekdays, time of the day, minute of the day, week of the year. It would be great if we could also include the festivals from the country we are studying as well. And the currency exchange rate for each day? That’s what ohse() does. Note: Even though this functionality is used in the corr_cross function automatically, for better custom results I’d recommend to manually add it before the pipeline and use its parameters to get the features you’d want to check.

    When is Ranked Cross-Correlations useful?

    The most trivial use for Ranked Cross-Correlations is to understand a dataset further. Normally, the first thing you do when you encounter a dataset would be an EDA (Exploratory Data Analysis). You will understand now how many rows and columns there are, how many missing values per variable, how many numerical vs categorical features, their distributions, etc (check lares::plot_df()). The next logical step would be to check the interactions between variables and their values (correlations would work just fine but only if you have 100% numerical values).

    Another useful case use is understanding clusters and what does each individual has in common for a group of observations. K-nearest neighbors algorithms might be great for creating similar groups but usually are hard to interpret, especially because they are unsupervised algorithms. Let’s say we ran K-means to group students and defined 5 groups. Now we need to understand, for each cluster, what do individuals have in common among themselves. Instead of exploring row by row, column by column, getting frequencies and making dozens of plots, why not run a ranked cross-correlation function to do the work for us?

    Cross-correlate Star Wars dataset we must!

    Let’s load dplyr’s starwars dataset and check how corr_cross() works with it. I would like to mention that I like Star Wars but am not a fan, so the insights mentioned bellow are 100% taken from the data and not from past knowledge.

    library(lares)
    library(dplyr)
    data("starwars")
    # Let's get rid of the lists inside the dataframe
    df <- select(starwars, -starships, -vehicles, -films)
    

    If you are not familiar with this dataset, I’ll quickly show its first six rows so you have an idea.

    head(df)
      name       height  mass hair_color  skin_color eye_color birth_year gender homeworld species
                                                
    1 Luke Skyw…    172    77 blond       fair       blue            19   male   Tatooine  Human  
    2 C-3PO         167    75 NA          gold       yellow         112   NA     Tatooine  Droid  
    3 R2-D2          96    32 NA          white, bl… red             33   NA     Naboo     Droid  
    4 Darth Vad…    202   136 none        white      yellow          41.9 male   Tatooine  Human  
    5 Leia Orga…    150    49 brown       light      brown           19   female Alderaan  Human  
    6 Owen Lars     178   120 brown, grey light      blue            52   male   Tatooine  Human 


    Basically, we have all of the characters of the movies (87) with some specific characteristics such as height, mass, hair colour, etc. It’s a small (but fun) dataset! Let’s run what we came here to see:

    corr_cross(df)
    

    Which will plot you the following:

    Yes, it is as easy as that. We can check the top correlations of variables and values ranked in descending order, excluding 100% correlations of course. From the plot above we can extract some interesting insights:

    – Characters which are hermaphrodites are commonly fat as well! Jabba is the only hermaphrodite character and happens to be the fattest as well, followed by Grievous which mass consists only of 12% of Jabba’s. Also, it(?) is the second oldest character, leaving Yoda as the champion with 896 years old!
    – Characters which are Kamionan (a species) usually come from Kamino, and have grey skin. The correlation might sound obvious because of both names, but if the planet was named Mars, then it would have been harder to detect. Interesting to notice that there is one human that also comes from Kamino (Boba Fett) and that is why the correlation is not 1 (100%).
    – Droids commonly do not have gender (or not known), no hair colour, and red eyes.
    – Gungans have orange eyes and their homeworld is Naboo.
    – Most humans have hair colour defined (thus have hair) and fair skin colour. This is an inverse correlation example because when the character is human species the negative coefficient establishes that hair colour none is not common.


    [The Illustrious Jabba The Hutt (…) | sideshow.com]

    With these facts at hand, everyone would think I’m a Star Wars fan (rather than a data geek)! Leaving jokes aside, these insights are usually what we need to get from our datasets. With corr_cross() you find them as easily as that. Now, let’s check some other parameters to help us improve further our EDA.

    Using the contains parameter you can check specific variables correlations. This option returns all Ranked Cross-Correlations that contains a certain string. Let’s say we want to check eye, hair, and skin colour in a single plot, then running corr_cross(df, contains = "color") will do. Give it a try!

    Also check the titanic data set’s Ranked Cross-Correlation; it doesn’t even need further explanations!

    data(dft)
    # Let's get rid of some noisy columns first
    dft <- select(dft, -Cabin, -Ticket)
    corr_cross(dft, top = 15)
    

    Local Cross-Correlation

    There is another kind of cross-correlation that returns all correlations in a single plot, not necessarily ranked. This will help us understand the skewness or randomness of some correlations found. It will also highlight the highest correlations for each of the variables used.

    corr_cross(df, type = 2)
    

    or something like

    corr_cross(df, type = 2, contains = "species")
    

    Other parameters

    Additionally there are other parameters such as method for selecting which method you wish to use for calculating correlations (pearson, kendall, or spearman), plot for returning a data frame with the results instead of a plot, max for setting a ceiling different than 100%, top for showing more or less results for the Ranked Cross-Correlations, and some others which can be check in the documentation: ?cross_corr(). You might also fin useful its very close brothers: corr_var() and corr().

    Feel free to share your results with other datasets and any interesting insights found with this method. I hope Ranked Cross-Correlations becomes an important tool for your future EDAs!

    Related Post

    Parsing Text for Emotion Terms: Analysis & Visualization Using R: Updated Analysis

    $
    0
    0

    Category

    Tags

    The motivation for an updated analysis: The first publication of Parsing text for emotion terms: analysis & visualization Using R published in May 2017 used the function get_sentiments("nrc") that was made available in the tidytext package. Very recently, the nrc lexicon was dropped from the tidytext package and hence the R codes in the original publication failed to run. The NRC emotion terms are also available in the lexicon package.

    This update provides a way around to leverage the NRC emotion terms made available in the lexicon package and show alternative R codes to parse text for emotion terms. The text data sets and the analysis figures are kept the same as the first publication.

    require(tidyverse)
    # assuming that the lexicon package has been installed already,
    # Load the NRC emotions lexicon in memory, then
    # Reshape the wide data format to a narrow data format
    # Finally, keep emotions words(terms) in nrc_data file
    nrc_data = lexicon::nrc_emotions %>%  
        gather("sentiment", "flag", anger:trust, -term) %>% 
        filter(flag==1)
    

    Recently, I read a post regarding a sentiment analysis of Mr Warren Buffett’s annual shareholder letters in the past 40 years written by Michael Toth. In this post, only five of the annual shareholder letters showed negative net sentiment scores, whereas a majority of the letters (88%) displayed a positive net sentiment score. Toth noted that the years with negative net sentiment scores (1987, 1990, 2001, 2002 and 2008), coincided with lower annual returns on investments and global market decline. This observation caught my attention and triggered my curiosity about emotion words in those same shareholder letters, and whether or not emotion words were differentially expressed among the 40 letters.

    With the explosion of digital and social media, there are various emoticons and emojis that can be embedded in text messages, emails, or other various social media communications, for use in expressing personal feelings or emotions. Emotions may also be expressed in textual forms using words. R offers the lexicon or the get_nrc_sentiment function via Syuzhet packages for analysis of emotion words expressed in text. Both packages implemented Saif Mohammad’s NRC Emotion lexicon, comprised of several words for emotion expressions of anger, fear, anticipation, trust, surprise, sadness, joy, and disgust.

    I have two companion posts on this subject; this post is the first part. The motivations for this post are to illustrate the applications of some of the R tools and approaches:

    • Analysis of emotion words in textual data
    • Visualization and presentation of outputs and results

    In the second part, unsupervised learning and differential expression of emotion words using R has been attempted.

    The Dataset

    Mr. Warren Buffett’s annual shareholder letters in the past 40-years (1977 – 2016) were downloaded from this site using the an R code obtained from here.

    ## The R code snippet to retrieve the letters was obtained from Michel Toth's post.
    library(pdftools)      
    library(rvest)       
    library(XML)
    # Getting & Reading in HTML Letters
    urls_77_97 <- paste('http://www.berkshirehathaway.com/letters/', seq(1977, 1997), '.html', sep='')
    html_urls <- c(urls_77_97,
                   'http://www.berkshirehathaway.com/letters/1998htm.html',
                   'http://www.berkshirehathaway.com/letters/1999htm.html',
                   'http://www.berkshirehathaway.com/2000ar/2000letter.html',
                   'http://www.berkshirehathaway.com/2001ar/2001letter.html')
    
    letters_html <- lapply(html_urls, function(x) read_html(x) %>% html_text())
    # Getting & Reading in PDF Letters
    urls_03_16 <- paste('http://www.berkshirehathaway.com/letters/', seq(2003, 2016), 'ltr.pdf', sep = '')
    pdf_urls <- data.frame('year' = seq(2002, 2016),
                           'link' = c('http://www.berkshirehathaway.com/letters/2002pdf.pdf', urls_03_16))
    download_pdfs <- function(x) {
      myfile = paste0(x['year'], '.pdf')
      download.file(url = x['link'], destfile = myfile, mode = 'wb')
      return(myfile)
    }
    pdfs <- apply(pdf_urls, 1, download_pdfs)
    letters_pdf <- lapply(pdfs, function(x) pdf_text(x) %>% paste(collapse=" "))
    tmp <- lapply(pdfs, function(x) if(file.exists(x)) file.remove(x)) 
    # Combine letters in a data frame
    letters <- do.call(rbind, Map(data.frame, year=seq(1977, 2016), text=c(letters_html, letters_pdf)))
    letters$text <- as.character(letters$text)
    

    Load additional required packages

    require(tidytext)
    require(RColorBrewer)
    require(gplots)
    theme_set(theme_bw(12))
    

    Descriptive Statistics

    Analysis steps of emotion terms in textual data included word tokenization, pre-processing of tokens to exclude stop words and numbers and then invoking the get_sentiment function using the Tidy package, followed by aggregation and presentation of results. Word tokenization is the process of separating text into single words or unigrams.

    Emotion words frequency and proportions

    total_words_count <- letters %>%
        unnest_tokens(word, text) %>%  
        anti_join(stop_words, by = "word") %>%                  
        filter(!grepl('[0-9]', word)) %>%
        group_by(year) %>%
        summarize(total= n()) %>%
        ungroup()
    
    emotion_words_count <- letters %>% 
      unnest_tokens(word, text) %>%                           
      anti_join(stop_words, by = "word") %>%                  
      filter(!grepl('[0-9]', word)) %>%
      inner_join(nrc_data, by=c("word"="term"))  %>%
      group_by(year) %>%
      summarize(emotions= n()) %>%
      ungroup()
    
    emotions_to_total_words <- total_words_count %>%
         left_join(emotion_words_count, by="year") %>%
                   mutate(percent_emotions=round((emotions/total)*100,1))
    
    ggplot(emotions_to_total_words, aes(x=year, y=percent_emotions)) +
         geom_line(size=1) +
         scale_y_continuous(limits = c(0, 35), breaks = c(0, 5, 10, 15, 20, 25, 30, 35)) +
         xlab("Year") + 
         ylab("Emotion terms / total words (%)") + theme(legend.position="none") +
         ggtitle("Proportion of emotion words usage \n in Mr. Buffett's annual shareholder letters")
    

    Gives this plot:

    Emotion words in the annual shareholder letters accounted for approximately 20% – 25% of the total words count (excluding stop words and numbers). The median emotion count was ~22% of the total words count.

    Depicting distribution of emotion words usage

    ### pull emotion words and aggregate by year and emotion terms
    emotions <- letters %>% 
      unnest_tokens(word, text) %>%                           
      anti_join(stop_words, by = "word") %>%                  
      filter(!grepl('[0-9]', word)) %>%
      inner_join(nrc_data, by=c("word"="term"))  %>%
      group_by(year, sentiment) %>%
      summarize( freq = n()) %>%
      mutate(percent=round(freq/sum(freq)*100)) %>%
      select(-freq) %>%
      ungroup()
    ### need to convert the data structure to a wide format
    emo_box = emotions %>%
    spread(sentiment, percent, fill=0) %>%
    ungroup()
    ### color scheme for the box plots (This step is optional)
    cols  <- colorRampPalette(brewer.pal(7, "Set3"), alpha=TRUE)(8)
    boxplot2(emo_box[,c(2:9)], col=cols, lty=1, shrink=0.8, textcolor="red",        xlab="Emotion Terms", ylab="Emotion words count (%)", main="Distribution of emotion words count in annual shareholder letters (1978 - 2016")
    

    Which gives this plot:

    Terms for all eight emotions types were expressed albeit at variable rates. Looking at the box plot, anger, sadness, surprise, and trust showed outliers. Besides, anger, disgust and surprise were skewed to the left, whereas Joy was skewed to the right. The n= below each box plot indicates the number of observations that contributed to the distribution of the box plot above it.

    Emotion words usage over time

    ## yearly line chart
    ggplot(emotions, aes(x=year, y=percent, color=sentiment, group=sentiment)) +
    geom_line(size=1) +
    geom_point(size=0.5) +
    xlab("Year") +
      ylab("Emotion words count (%)") +
      ggtitle("Emotion words expressed in Mr. Buffett's \n annual shareholder letters")
    

    Gives this plot:

    Clearly emotion terms referring to trust and anticipation were expressed consistently higher than the other emotion terms in all of the annual shareholder letters. Emotion terms referring to disgust, anger and surprise were expressed consistently lower than the other emotion terms at almost all time points.

    Average emotion words expression using bar charts with error bars

    ### calculate overall averages and standard deviations for each emotion term
    overall_mean_sd <- emotions %>%
         group_by(sentiment) %>%
         summarize(overall_mean=mean(percent), sd=sd(percent))
    ### draw a bar graph with error bars
    ggplot(overall_mean_sd, aes(x = reorder(sentiment, -overall_mean), y=overall_mean)) +
         geom_bar(stat="identity", fill="darkgreen", alpha=0.7) + 
         geom_errorbar(aes(ymin=overall_mean-sd, ymax=overall_mean+sd), width=0.2,position=position_dodge(.9)) +
         xlab("Emotion Terms") +
         ylab("Emotion words count (%)") +
         ggtitle("Emotion words expressed in Mr. Buffett's \n annual shareholder letters (1977 – 2016)") + 
         theme(axis.text.x=element_text(angle=45, hjust=1)) +
         coord_flip( )
    

    Which gives this plot:

    Emotion words referring to trust, anticipation and joy were over-represented and accounted on average for approximately 60% of all emotion words in all shareholder letters. On the other hand, disgust, surprise and anger were the least expressed emotion terms and accounted on average for approximately 18% of all emotion terms in all shareholder letters.

    Emotion terms usage over time compared to 40-years averages

    For the figure below, the 40-year averages of each emotion terms shown in the above bar chart were subtracted from the yearly percent emotions for any given year. The results were showing higher or lower than average emotion expression levels for the respective years.

    ## Hi / Low plots compared to the 40-years average
    emotions_diff <- emotions  %>%
         left_join(overall_mean_sd, by="sentiment") %>%
         mutate(difference=percent-overall_mean)
    
    ggplot(emotions_diff, aes(x=year, y=difference, colour=difference>0)) +
    geom_segment(aes(x=year, xend=year, y=0, yend=difference),
    size=1.1, alpha=0.8) +
    geom_point(size=1.0) +
    xlab("Emotion Terms") +
         ylab("Net emotion words count (%)") +
         ggtitle("Emotion words expressed in Mr. Buffett's \n annual shareholder letters (1977 - 2016)") + 
    theme(legend.position="none") +
    facet_wrap(~sentiment, ncol=4)
    

    Gives this plot:

    Red lines show lower than the 40-year average emotion expression levels, while blue lines indicate higher than the 40-year average emotion expression levels for the respective years.

    Concluding Remarks

    Excluding stop words and numbers, approximately 1 in 4 words in the annual shareholder letters represented emotion terms. Clearly, emotion terms referring to trust, anticipation and joy accounted for approximately 60% of all emotion terms. There were also very limited emotions of fear (approximately 1 in 10 emotion terms). In conclusion, R offers several packages and functions for the evaluation and analyses of emotions words in textual data, as well as visualization and presentation of analysis results. Some of those packages and functions have been illustrated in this post. Hopefully, you find this post and analyses and visualization examples helpful.

    Related Post

    Map Visualization of COVID-19 Across the World with R

    $
    0
    0

    Category

    Tags

    As you may all know, a new virus named a coronavirus (COVID-19) is affecting a lot of people all over the world. The symptoms are ranging from the common cold to severe acute respiratory syndrome. Read more about COVID-19 from WHO.

    Update: DataScience+ developed an interactive dashboard with Shiny to monitor the spread of COVID-19 across the world. Hope you find it useful.

    In this post, I will show how the COVID-19 is distributed across the world by doing a map visualization of the confirmed cases by country. I would like to thank Johns Hopkins CSSE for providing the datasets. The data is across many sources, but Johns Hopkins CSSE complied in one single file. Find more about the dataset on their Github page.

    I should note that form making the figure below, I was mostly based in the post named “Bubble map with ggplot2” by Yan Holtz published at The R Graph Gallery. It is a great post which I highly recommend to read if you want to make map visualizations.

    First I load the libraries needed for this post:

    library(tidyverse)
    library(ggplot2)
    library(readr)
    library(maps)
    library(viridis)
    

    Get the data from Github of Johns Hopkins CSSE. The data is in wide format, and I will select only the last column which is the date when I wrote this post.

    ## get the COVID-19 data
    datacov <- read_csv("time_series_19-covid-Confirmed.csv")
    ## get the world map
    world <- map_data("world")
    
    # cutoffs based on the number of cases
    mybreaks <- c(1, 20, 100, 1000, 50000)
    
    ggplot() +
     geom_polygon(data = world, aes(x=long, y = lat, group = group), fill="grey", alpha=0.3) +
     geom_point(data=datacov, aes(x=Long, y=Lat, size=`3/3/20`, color=`3/3/20`),stroke=F, alpha=0.7) +
     scale_size_continuous(name="Cases", trans="log", range=c(1,7),breaks=mybreaks, labels = c("1-19", "20-99", "100-999", "1,000-49,999", "50,000+")) +
        # scale_alpha_continuous(name="Cases", trans="log", range=c(0.1, 0.9),breaks=mybreaks) +
        scale_color_viridis_c(option="inferno",name="Cases", trans="log",breaks=mybreaks, labels = c("1-19", "20-99", "100-999", "1,000-49,999", "50,000+")) +
        theme_void() + 
        guides( colour = guide_legend()) +
        labs(caption = "Data Repository provided by Johns Hopkins CSSE. Visualization by DataScience+ ") +
        theme(
          legend.position = "bottom",
          text = element_text(color = "#22211d"),
          plot.background = element_rect(fill = "#ffffff", color = NA), 
          panel.background = element_rect(fill = "#ffffff", color = NA), 
          legend.background = element_rect(fill = "#ffffff", color = NA)
        )
    

    The geom_polygon make the map in the figure and geom_point the points which refer to the countries.

    Related Post

    How to Get Stock Prices and Plot Them?

    $
    0
    0

    Category

    Tags

    Prices are subject to analysis in different fields such as agriculture, labor, housing, and many others. The financial market is not an exception, and consequently, the prices of the assets involved in its world such as stocks and bonds are needed for many purposes in economics and finance. In this article, I explain how to get prices for several stocks using R package quantmod and plot them using ggplot2.

    quantmod has its own plotting tools that are useful for algorithmic trading and technical analysis (for advanced visualizations on algorithmic trading you can see Visualizations for Algorithmic Trading in R). Nevertheless, if you just want to plot time series with no extra information ggplot2 provides easier and flexible options for formatting. This exercise consists of 1) getting stock prices for 3 top US banks from the beginning of February to the end of March and 2) plotting the time series including the following details:

    • Title and subtitle
    • x and y labels
    • Caption
    • Colors according to each bank

    Loading required Packages

    library(quantmod)
    library(ggplot2)
    library(magrittr)
    library(broom)
    

    First, let’s set the dates for the period to plot

    start = as.Date("2020-02-01") 
    end = as.Date("2020-03-31")
    

    Getting data

    Now I request quantmod to get the stock prices for Citibank (C), JP Morgan Chase (JPM), and Wells Fargo (WFC).
    The function getSymbols will get the data for you using 3 main arguments: the ticker of the companies, the source of the data, and the period.

    Now provide to getSymbols the inputs for the arguments. If you want more than one company you can add using the vector command c().

    getSymbols(c("JPM", "C", "WFC"), src = "yahoo", from = start, to = end)
    

    getSymbols generate 3 xts objects with an index column to reference the date, and 6 additional columns with the following information: open, high, low, close, volume, and adjusted. You can see the first lines of the object using the following command:

    head(WFC)
               WFC.Open WFC.High WFC.Low WFC.Close WFC.Volume WFC.Adjusted
    2020-02-03    47.24    47.72   47.03     47.12   15472000     46.62256
    2020-02-04    47.70    47.84   47.25     47.26   14973300     46.76108
    2020-02-05    47.90    48.40   47.78     48.31   20141800     47.80000
    2020-02-06    48.44    48.50   47.85     47.98   18259200     47.98000
    2020-02-07    47.73    48.00   47.48     47.84   13174600     47.84000
    2020-02-10    47.67    47.86   47.42     47.77   18124800     47.77000


    The next step is to create a data frame that captures all rows with just the adjusted price column of each bank. The adjusted price is used to account for dividend payments. This data frame is transformed into a time series object with the function as.xts().

    stocks = as.xts(data.frame(C = C[, "C.Adjusted"], JPM = JPM[, "JPM.Adjusted"], WFC = WFC[, "WFC.Adjusted"])) 
                Citi JP Morgan Wells Fargo
    2020-02-03 75.13  131.9984    46.62256
    2020-02-04 76.50  133.8986    46.76108
    2020-02-05 78.85  136.1749    47.80000
    2020-02-06 78.97  136.1947    47.98000
    2020-02-07 78.69  135.7593    47.84000
    2020-02-10 78.48  136.3234    47.77000


    Stocks is an xts object with an index column for date reference and 3 columns for adjusted stock prices. Now is required to do two additional transformations to stocks before plotting. 1) Assigning names to the columns given that at this point ggplot2 will read them as 1, 2, and 3. So first I assign the bank name, then 2) define the index column as a date.

    names(stocks) = c("Citi", "JP Morgan", "Wells Fargo")
    index(stocks) = as.Date(index(stocks))
    

    Plotting

    Now I can plot using ggplot2. The 3 main arguments will be the dataset stocks, aes() which indicate that dates are assigned to x-axis and values to the y-axis, and color that assigns a color to the 3 series. Color is the argument that makes it possible to include more than one time series in the plot.

    After providing the 3 main arguments, I add the layer for the shape of the plot. I want a line as it is the most appropriate for time series, so I add the command geom_line().

    stocks_series = tidy(stocks) %>% 
      
      ggplot(aes(x=index,y=value, color=series)) + geom_line()
    
    stocks_series
    

    This is a basic version, so I include more details with the following commands:

    labs() allows to include title, subtitle, and caption in a single code.

    xlab() and ylab(), to name axis, I set “Date” for x and “Price” for y.

    scale_color_manual() to change the colors of the lines, I use colors that are representative of each bank.

    stocks_series1 = tidy(stocks) %>% 
      
      ggplot(aes(x=index,y=value, color=series)) + geom_line() +
      labs(title = "Top US Banks: Daily Stock Prices January 2020 - April 2020",
           
                subtitle = "End of Day Adjusted Prices",
                caption = " Source: Yahoo Finance") +
      
      xlab("Date") + ylab("Price") +
      scale_color_manual(values = c("#003B70", "#000000", "#cd1409"))
    
    stocks_series1
    

    I hope this little “how to” is useful for you!!
    Cheers!

    Andrés

    Related Post


    Using R to Analyze & Evaluate Survey Data – Part 1

    $
    0
    0

    Category

    Tags

    Survey data remains an integral part of organizational science and rightfully so. With ever-increasing means of data collection brought about by more nuanced and faster technologies, organizations have no shortage of data – but it would be remiss to discount the value of self-report data to better understand the psychology of workers. Alas, not all surveys are created equal, or rather equally well; so, it’s important to utilize scientifically established methods to evaluate them and draw the appropriate inferences from the data collected.

    The full survey construction process should include the following:

    1. Define the construct and content domain (e.g., emotional intelligence.)
    2. Generate items to cover the content domain
    3. Assess content validity
    4. Large scale administration
    5. Exploratory factor analysis
    6. Internal consistency reliability analysis (i.e., Cronbach’s alpha)
    7. Confirmatory factor analysis
    8. Convergent/discriminant validity evidence
    9. Criterion validity evidence
    10. Replicate steps 6 – 9 in a new sample(s)

    In this article, steps 5 and 6 of the survey evaluation process are covered using R. Another post may potentially address later steps (7-9) so be sure to bookmark this page! For insights or recommendations from your friendly neighborhood I-O psychologist regarding the early stages of survey construction, feel free to contact the author. The construct of interest for this scale development project is human-machine preferences.

    Load necessary libraries.

    #load libraries
    library(tidyverse) #masks stats::filter, lag
    library(tibble)
    library(psych) #masks ggpplot2:: %+%, alpha
    library(GGally) #masks dbplyr::nasa
    library(kableExtra) #masks dplyr::group_rows
    library(MVN)
    

    Import Data

    This survey was developed at a research institution and the IRB protocols mandated that the data are not publicly hosted. A completely de-identified version was used for this walkthrough and preprocessed fully before being analyzed, so a glimpse into the data is provided (pun intended).

    Note: Some of the survey items were labeled with “_R” signaling that they are reverse coded. This was handled accordingly in the data preprocessing stage as well.

    glimpse(dat)
    Rows: 381
    Columns: 16
    $ HUM1     3, 4, 1, 4, 3, 4…
    $ HUM2_R   3, 2, 2, 4, 4, 4…
    $ HUM3_R   2, 5, 3, 3, 2, 3…
    $ HUM4     2, 3, 3, 2, 3, 3…
    $ HUM5     2, 4, 5, 4, 2, 3…
    $ HUM6_R   2, 2, 1, 2, 2, 3…
    $ HUM7_R   2, 4, 2, 3, 4, 5…
    $ HUM8_R   1, 3, 1, 2, 2, 2…
    $ HUM9_R   4, 2, 3, 4, 3, 3…
    $ HUM10    2, 2, 2, 4, 2, 3…
    $ HUM11_R  3, 2, 2, 4, 4, 3…
    $ HUM12    4, 4, 4, 4, 3, 5…
    $ HUM13_R  1, 4, 1, 2, 2, 3…
    $ HUM14_R  3, 4, 2, 4, 3, 3…
    $ HUM15_R  2, 4, 1, 4, 3, 2…
    $ HUM16_R  2, 5, 2, 2, 2, 3…
    
    
    summary(dat)
          HUM1           HUM2_R          HUM3_R           HUM4            HUM5      
     Min.   :1.000   Min.   :1.000   Min.   :1.000   Min.   :1.000   Min.   :1.000  
     1st Qu.:2.000   1st Qu.:2.000   1st Qu.:2.000   1st Qu.:3.000   1st Qu.:3.000  
     Median :3.000   Median :3.000   Median :3.000   Median :3.000   Median :4.000  
     Mean   :2.869   Mean   :3.055   Mean   :2.832   Mean   :3.105   Mean   :3.714  
     3rd Qu.:4.000   3rd Qu.:4.000   3rd Qu.:4.000   3rd Qu.:4.000   3rd Qu.:5.000  
     Max.   :5.000   Max.   :5.000   Max.   :5.000   Max.   :5.000   Max.   :5.000  
         HUM6_R          HUM7_R          HUM8_R          HUM9_R          HUM10      
     Min.   :1.000   Min.   :1.000   Min.   :1.000   Min.   :1.000   Min.   :1.000  
     1st Qu.:2.000   1st Qu.:2.000   1st Qu.:1.000   1st Qu.:2.000   1st Qu.:3.000  
     Median :2.000   Median :3.000   Median :2.000   Median :3.000   Median :3.000  
     Mean   :2.136   Mean   :2.911   Mean   :1.848   Mean   :2.942   Mean   :3.089  
     3rd Qu.:3.000   3rd Qu.:4.000   3rd Qu.:2.000   3rd Qu.:4.000   3rd Qu.:4.000  
     Max.   :5.000   Max.   :5.000   Max.   :5.000   Max.   :5.000   Max.   :5.000  
        HUM11_R          HUM12          HUM13_R         HUM14_R         HUM15_R     
     Min.   :1.000   Min.   :1.000   Min.   :1.000   Min.   :1.000   Min.   :1.000  
     1st Qu.:3.000   1st Qu.:4.000   1st Qu.:2.000   1st Qu.:3.000   1st Qu.:2.000  
     Median :4.000   Median :4.000   Median :2.000   Median :3.000   Median :3.000  
     Mean   :3.535   Mean   :4.108   Mean   :2.491   Mean   :3.357   Mean   :3.234  
     3rd Qu.:4.000   3rd Qu.:5.000   3rd Qu.:3.000   3rd Qu.:4.000   3rd Qu.:4.000  
     Max.   :5.000   Max.   :5.000   Max.   :5.000   Max.   :5.000   Max.   :5.000  
        HUM16_R     
     Min.   :1.000  
     1st Qu.:2.000  
     Median :3.000  
     Mean   :3.045  
     3rd Qu.:4.000  
     Max.   :5.000 


    Exploratory Data Analysis

    Pairs Plot

    The `GGally` package is an extension of the ubiquitous `ggplot2` visualization library and is incredibly poweful. The ggpairs function creates a pairs plot of the survey items.

    (pairsPlot = GGally::ggpairs(data = dat,
                        upper = "blank",
                        diag = list(continuous = wrap("densityDiag")),
                        lower = list(continuous = wrap(ggally_smooth_lm)),
                        title = "Pairs Plot of Human-Machine Items"))
    

    Correlations

    Correlation analyses seek to measure the statistical relationship between two (random) variables. There is a range of techniques used to assess the relationship between varying data types with the most well-known being Pearson’s-product moment correlation. This (parametric) analysis is effective when continuous variables have a linear relationship and follow a normal distribution; however, surveys usually include Likert-type response options (e.g., Strongly agree to Strongly disagree) and modeling the data as ordinal can sometimes lead to more accurate parameter estimates…to an extent – as the number of response options increase, the more likely the data can be modeled as continuous anyway because the impact becomes negligible.

    Opinions will vary but my personal threshold for the number of response options before modeling the data as continuous is 6, but best practice is probably to model the data a couple of ways in order to establish the best analysis. Check out this article to learn more data types and modeling distributions.

    All of the survey items within the current scale utilized a 5-point Likert-type response format and polychoric correlations were calculated. Polychoric correlations help allay the attenuation that occurs when modeling discretized data by using the more appropriate joint distribution. R’s psych library has the polychoric function along with a plethora of others that are particularly useful for survey analysis.

    corrs = psych::polychoric(dat)
    
    #correlation viz
    GGally::ggcorr(data = NULL, 
           cor_matrix = corrs[["rho"]], 
           size = 2,
           hjust = .75,
           nbreaks = 7,
           palette = "RdYlBu",
           label = TRUE, 
           label_color = "black",
           digits = 2,
           #label_alpha = .3, 
           label_round = 2, 
           label_size = 1.85, 
           layout.exp = 0.2) + 
      theme(legend.position = "none")
    

    report figure

    Parallel Analysis

    Parallel analysis (PA) is a procedure that helps determine the number of factors (EFA) or components (PCA) to extract when employing dimension reduction techniques. The program is based on the Monte Carlo simulation and generates a data set of random numbers with the same sample size and variables/features as the original data. A correlation matrix of the random data is computed and decomposed thus creating corresponding eigenvalues for each factor — when the eigenvalues from the random data are larger than the eigenvalues from the factor analysis, one has evidence supporting that the factor mostly comprised of random noise.

    The current data was subjected to the PA and the following scree plot was produced.

    The PA proposes that 3-5 factors most effectively explain the underlying structure of the data. This method is better than some of the older guidelines associated with dimensionality reduction such as the Kaiser criterion that was geared more toward PCA.

    Note. PA is an iterative process that needs parameter specifications very similar to EFA (i.e., specified correlation, rotation, estimation method, etc.) and some researchers may conduct the analysis after running the EFAs. Irrespective of the order of operations, the outputs should inform one another.

    Exploratory Factor Analysis

    Exploratory factor analysis (EFA) is a multivariate approach whose overarching goal is to identify the underlying relationships between measured variables. As briefly mentioned in the PA section, it is entirely based on correlations (the model can account for uncorrelated factors via rotation methods) and is largely used in scale development across disciplines. EFA is but one part of the factor analytic family and a deep dive into the procedure is beyond the scope of this post. Check out UCLA’s link for a practical introduction into the analysis.

    An important step in EFA is specifying the number of factors for the model. For this walk-through, the psych package’s fa function was used in a loop to run a series of iterative models between 1 and 5 factors. In psychological research, most of the phenomena investigated are related to one another to some extent, and EFA helps parse out groups that are highly related (within-group) but distinct (between-group) from one another. The model specifies the weighted least squares (WLS) estimation method in an effort to obtain more accurate parameter estimates when using polychoric correlations. Ultimately, five models are individually run and stored in a list so the output(s) can be called and compared.

    efa_mods_fun = function(r, n_models = NULL, ...){
        
        if (!is.matrix(r))
            stop("r must be a matrix of covariances!")
        
        efa_models = list()
        
        for (i in seq(n_models)){
            efa_models[[i]] = fa(r, 
                                 n.obs = nrow(dat),
                                 nfactors = i, 
                                 rotate = "oblimin", 
                                 # n.iter = 1000,
                                 fm = "wls", 
                                 max.iter = 5000)
        }
        return(efa_models)
    }
    
    #run series of models; 1:5-factor solutions
    modsEFA_rnd1 = efa_mods_fun(corrs[["rho"]], n_models = 5)
    

    Fit Indices

    Note! The code used to extract the fit statistics for each model was not very programmatic, so I redacted it from this tutorial page. Instead, check out the source code in the GitHub repo found here and begin reviewing at line 158. My plan is to eventually develop code that can take a model’s output and generate a table that has the same structure but without the manual repetitiveness. Since this table needs to be created for each iteration of model comparisons, I want to ultimately prevent the likelihood of introducing errors.

    The fit for each model can be compared across a variety of indices. Below, the Chi-squared statistic, Tucker-Lewis Index (TLI), Bayesian Information Criteria (BIC), root mean squared error (RMSEA), and the amount of variance explained by the model are all assessed to determine which model best described the data and is displayed in a neat table using the kableExtra package. To learn more about what the indices measure and what information they convey, visit this link.

    #visualize table
    modsFit_rnd1 %>% 
      rownames_to_column() %>% 
      rename(
        'Model Solution(s)' = rowname, 
        'X\u00B2' = a,
        'TLI' = b, 
        'BIC' = c, 
        'RMSEA' = d, 
        'Var Explained' = e
      ) %>% 
      mutate(
        'Model Solution(s)' = c('1 Factor', '2 Factors', '3 Factors', 
                                '4 Factors', '5 Factors')
      ) %>% 
      kableExtra::kable('html', 
            booktabs = TRUE, 
            caption = 'EFA Model Fit Indices - Round 1') %>% 
      kable_styling(bootstrap_options = c('striped', 'HOLD_position'),
                    full_width = FALSE, 
                    position = 'center') %>% 
      column_spec(1, width = '8cm') %>% 
      pack_rows(
        index = c('HMPS ' = 5),
        latex_gap_space = '.70em') %>% 
      row_spec(3, bold = T, color = "white", background = "#D7261E")


    According to the fit statistics, the 3-factor model best describes the data but the journey does not conclude here because assessing the item level statistics helps determine the structure of the model. Ideally, simple structure is the goal — this means that each item will individually load unto a single factor. When an item loads unto multiple factors it is known as cross-loading. There is nothing inherently “wrong” with cross-loading but for survey development, establishing strict rules provides more benefits in the long run. The cut-off value for a “useful” item loading was set at .45, thus any item that had a loading less than the cut-off was removed before the model was re-run.

    Note. Because of the estimation method used in EFA, a factor loading for EACH item and FACTOR will be calculated. The closer the loading value is to 1 the better.

    Factor Loading Diagram

    psych::fa.diagram(modsEFA_rnd1[[3]], 
               main = "WLS using Poly - Round 1", 
               digits = 3, 
               rsize = .6,
               esize = 3,
               size = 5,
               cex = .6,
               l.cex = .2,
               cut = .4, 
               marg = (c(.5, 2.5, 3, .5)))
    

    Based on our model, each item cleanly loaded unto a single factor and the only item with a loading less than the specified cut-off value was HUM5. It was removed before estimating the models a second time.

    Round 2

    Most psychometricians recommend removing one item at a time before rerunning the models and calculating fit statistics and item loadings. Unfortunately, I have not developed a streamlined process for this using R (nor has anyone from my very specific Google searches) but perhaps this will be my future contribution to the open source community!

    After rerunning the models, again the 3-factor solution is optimal. Let’s review the item loadings next to see how the loadings altered.

    The fa.diagram function provides a good overall view of individual item loadings, but the true beauty of R, although a functional programming language, is its ability to operate from an object-oriented paradigm as well. Each model that was run had its respective output so next, let’s extract the loadings from each model and visualize the loadings using ggplot.

    #factor loadings of each model
    modsEFA_loadings = list()
    #loop
    for (i in seq_along(modsEFA_rnd2)) { 
      modsEFA_loadings[[i]] = rownames_to_column(
        round(data.frame(
          modsEFA_rnd2[[i]][["loadings"]][]), 3),  
        var = "Item") %>% 
        gather(key = "Factor", value = "Loading", -1)
    }
    

    Best Competing Model

    Visualize the individual item loadings from the best competing model: 3-Factor solution!

    #viz of factor loadings
    ggplot(data = modsEFA_loadings[[3]], 
           aes(fct_inorder(Item), 
               abs(Loading), 
               fill = Factor)
           ) + 
      geom_bar(stat = "identity", width = .8, color = "gray") +
      coord_flip() +
      facet_wrap(~ Factor) +
      #scale_x_discrete(limits = rev(unique(loadings[[1]]))) +
        labs(
          title = "Best Competing Model",
          subtitle = "3-Factor Solution",
          x = "Item",
          y = "Loading Strength"
          ) +
        theme_gray(base_size = 10) +
        theme(legend.position = "right") + 
      geom_hline(yintercept = .45, linetype = "dashed", color = "red", size = .65)
    

    The red dashed line represents the cut-off value of .45, indicating that anything below the read line is “meaningless” and anything above as “useful.” This visualization also shows the extent to which the items load unto all the factors to help inspect potential cross-loading. We have achieved simple structure since no items are cross-loading.

    Conclusion

    Hopefully, this tutorial proves to be insightful for survey analysis. The steps included are by no means perfect and the processes will almost certainly change based on the researchers’ choices (e.g., modeling Pearson correlations vs polychoric, setting a more strict factor loading cut-off value, etc.). Regardless of the analytical decisions, using survey science to explore and analyze the development process is vital (and fun!). All code is hosted on GitHub.

    Related Post

    An R alternative to pairs for -omics QC

    $
    0
    0

    Category

    Tags

    Introduction

    The Problem: I've got a couple of problems with the commonly used “pairs” plot in R for quality control in -omics data. (1) It's not that space-efficient since it only uses half the space for datapoints and (2) the scatterplot isn't very informative. When I look at those scatter plots it's hard to tell anything about the spread of the data or any normalization problems. This is particularily true for proteomics data where the high dynamic range can obscure lower abundance points.

    The Solution: A panel of MA plots (Minus-Average). The MA plot shows fold-change vs average intensity for a pair of samples. It lets you see difference between sample groups as fold-change which I think is a useful unit for comparison and visualizes normalization problems. Rather than plot each against each we will only compare samples between groups to save space.

    This goes along with a previous post of mine that attempts to convince biologists of the value of putting tables of data into tidy format. This method takes advantage of pivoting data to succintly generate a panel of MA plots

    suppressPackageStartupMessages(library(tidyverse))
    library(GGally)
    library(DEFormats)
    

    Set up the data

    I'll start with simulated data that will resemble a gene expression study. A proteomics dataset would be similar. The dataset will have 8 samples, half of them treated, half control. 7 of the samples will approximately the same but Sample 4 will have a 3-fold increase compared to the rest to illustrate how MA-plots help identify problems with normalization.

    counts <- simulateRnaSeqData(n = 5000, m = 8)
    counts[, 4] <- counts[, 4] *  3
    
    targets <- data.frame(sample = colnames(counts), group = c(rep("control", 4), rep("treated", 4)))
    

    The ggpairs function from the GGally package does a decent job of the pairs plot.

    ggpairs(data.frame(counts))
    

    The pairs plot tells us something about the data. The correlation is nice to have and if any sample was wildly different from the others it would show up in the scatter plot. Still I don't think it conveys the information very efficiently.

    MA plot panel

    Typically I would start by pivoting all the count data to a single columns and joining in the metadata. But I need to associate control and treated data for each gene for each sample so the usual method won't work. It took me a while to fall on the solution: we have to pivot the control and treated samples separately. So for each gene we will have a control sample name, a treated sample name and control and treated count data. Those can be used to calculate Fold-change and intensity.

    control_samples <- targets$sample[targets$group == "control"]
    treated_samples <- targets$sample[targets$group == "treated"]
    
    data.frame(counts) %>%
      rownames_to_column("gene") %>%
      pivot_longer(all_of(control_samples), names_to = "control_sample", values_to = "control_count") %>%
      pivot_longer(all_of(treated_samples), names_to = "treated_sample", values_to = "treated_count") %>%
      mutate(FC = treated_count / control_count) %>%
      mutate(Intensity = (treated_count + control_count) / 2)
    ## # A tibble: 80,000 x 7 
    ##    gene  control_sample control_count treated_sample treated_count    FC Intensity
    ##    <chr> <chr>                  <dbl> <chr>                  <dbl> <dbl>     <dbl>
    ##  1 gene1 sample1                  103 sample5                   71 0.689      87  
    ##  2 gene1 sample1                  103 sample6                   79 0.767      91  
    ##  3 gene1 sample1                  103 sample7                   76 0.738      89.5
    ##  4 gene1 sample1                  103 sample8                  118 1.15      110. 
    ##  5 gene1 sample2                   82 sample5                   71 0.866      76.5
    ##  6 gene1 sample2                   82 sample6                   79 0.963      80.5
    ##  7 gene1 sample2                   82 sample7                   76 0.927      79  
    ##  8 gene1 sample2                   82 sample8                  118 1.44      100  
    ##  9 gene1 sample3                   89 sample5                   71 0.798      80  
    ## 10 gene1 sample3                   89 sample6                   79 0.888      84  
    ## # ... with 79,990 more rows
    

    All that's left to do now is plot. Facet_grid will let us split the samples up.

    data.frame(counts) %>%
      rownames_to_column("gene") %>%
      pivot_longer(all_of(control_samples), names_to = "control_sample", values_to = "control_count") %>%
      pivot_longer(all_of(treated_samples), names_to = "treated_sample", values_to = "treated_count") %>%
      mutate(FC = treated_count / control_count) %>%
      mutate(Intensity = (treated_count + control_count) / 2) %>%
      ggplot(aes(x = Intensity, y = FC)) +
      geom_point(alpha = 0.5, na.rm = TRUE) +
      scale_x_continuous(trans = "log10") +
      scale_y_continuous(trans = "log2", breaks = 2^seq(-4, 4, 2)) +
      geom_hline(yintercept = 1) +
      labs(x = "Intensity", y = "Fold Change, treated vs control") +
      facet_grid(rows = vars(treated_sample), cols = vars(control_sample))
    

    The change in abundance in sample 4 shows up much more clearly now. This isn't a common way to plot the data so it might require some explaining to your colleagues but worth the effort in my opinion.

    Related Post

    Linking R and Python to retrieve financial data and plot a candlestick

    $
    0
    0

    Category

    Tags

    I am way more experienced with R than with Python and prefer to code in this language when possible. This applies, especially when it is about visualizations. Plotly and ggplot2 are fantastic packages that provide a lot of flexibility. However, every language has its limitations, and the best results stem from their efficient combination.

    This week, I created the candlestick below, and I think it’s an excellent case study to illustrate a few things:

  • How to download financial data from investing.com using the investpy package in Python
  • How to efficiently combine the capabilities of Python and R deploying the reticulate package
  • How to construct a nicely formatted candlestick chart with ggplot2, ggthemes and two simple custom functions
  • How to export the result in different image formats, including high-resolution Scalable Vector Graphics (SVG)
  • The Python part

    Let’s start with the Python code required. First, we need to install the investpy package using pip to run the simple function below. Investpy is a fantastic and very powerful wrapper around the public API of the investing.com page. It allows the retrieval of end of day price data for a wide range of financial instruments, including stocks, bonds, ETFs, mutual funds, indices, currencies, commodities and cryptocurrencies, as well as the download of selected meta-data. Detailed documentation can be found here or in pdf format under this link. Save the function defined below in a python script.

    #pip install investpy
    
    def get_fx_cross_investpy(currency_cross,st_date,ed_date):    
        import investpy
        data = investpy.get_currency_cross_historical_data(currency_cross=currency_cross, from_date=st_date, to_date=ed_date)
        return(data)
    

    The R part

    To use the previously defined Python function in R and to subsequently plot the data, we require the following four packages that can be installed easily from CRAN.

    install.packages("reticulate")
    install.packages("ggplot2")
    install.packages("ggthemes")
    install.packages("scales")
    

    Defining a pretty theme

    The ggthemes package comes with a few nice default themes for ggplot2 graphics. So you can, for instance, replicate the famous design of the Economist or the appearance of typical Stata charts. However, it is also possible to adapt these themes and create your unique default layout. I demonstrate this below for my standard formatting. The function defined here is later used in the candlestick function.

    theme_aq_black_default_font<-
      function (base_size = 12, base_family = "") 
      {
        library(ggplot2)
        library(ggthemes)
        library(scales)
        col_aq2<-as.character(c("#04103b","#dd0400","#3b5171","#5777a7","#969696","#BDBDBD","#D9D9D9","#F0F0F0"))
        
        theme_hc(base_size = base_size, base_family = base_family) %+replace% 
    

    The candlestick function

    Candlesticks are widely used in the visualization of price data and technical analysis. It allows viewers to quickly gauge the significance of market moves and analyze potential resistance levels or extraordinary price jumps that may be reverted in the future. To construct the daily candlestick displayed above, we require daily opening and closing prices as well as intraday highs and lows. Fortunately, this is all available on investing.com and can be retrieved as a handy data frame with our function defined above.

    ggplot_candlestick<-function(df,width=0.9,chart_title,chart_subtitle)
    {
    	library(ggplot2)
      df$Date<-row.names(df)
      df$Date<-as.Date(df$Date,"%Y-%m-%d")
      df$chg  df$Open, "dn", "up")
      cols<-as.character(c("#04103b","#dd0400","#3b5171","#5777a7","#969696","#BDBDBD","#D9D9D9","#F0F0F0"))
      
      p<-
        ggplot(data=df,aes(x=as.Date(Date), y=High))+
        geom_linerange(aes(ymin=Low, ymax=High)) +
        geom_rect(aes(xmin = Date - width/2 * 0.9, xmax = Date + width/2 * 0.9, ymin = pmin(Open, Close), ymax = pmax(Open, Close), fill = df$chg)) + 
        scale_fill_manual(values = c("up" = "darkred", "dn" = "darkgreen"))+
        scale_colour_manual(values = cols)+
        theme_aq_black_default_font(base_size=18)+
        labs(color='')+
        labs(title=chart_title,subtitle=chart_subtitle,x ="")+
        labs(caption = paste0('Source: DataScience+, Investing.com  ', Sys.Date()))+
        guides(colour = guide_legend(nrow = 1))+
        scale_x_date(labels = date_format("%y/%m"))+
        theme(legend.position = "none",legend.margin=margin(-20,-20,-20,-20),legend.box.margin=margin(0,0,30,0))+
        ylab("")+
        theme(plot.margin=margin(l=5,r=20,b=5,t=5))
    
      return(p)
    }


    Plot the data and export the graphic

    Last but not least, let’s combine all these modules and execute them step by step. Once we have loaded our Python function employing the reticulate package, we can use it in R to retrieve the financial data from investpy. We can subsequently use our previously defined R functions to create the candlestick plot. The plot can then be exported easily as a PNG or SVG graphic utilizing ggsave.

    # Load the python function and retrieve the financial data
    library(reticulate)
    source_python("C:/Users/Fabian/Desktop/get_rates_investing.com.py")
    df<-get_fx_cross_investpy("USD/RUB",'01/01/2022','01/05/2022')   
    
    # Use the R functions and plot the data
    p<-ggplot_candlestick(df,chart_title="Following its crash, the Russian Ruble rebounded sharply",chart_subtitle="USD/RUB exchange rate")
    p
    
    # Save the plot
    target_folder<-"C:/Users/Fabian/Desktop/"
    ggsave(file=paste0(target_folder,"candlestick_usd_rub.svg"), plot=p, width=9, height=5)
    ggsave(file=paste0(target_folder,"candlestick_usd_rub.png"), plot=p, width=9, height=5)
    

    Related Post

    A novel approach to visualize the categorical data in R

    $
    0
    0

    Category

    Tags

    Recently, I came across to the ggalluvial package in R. This package is particularly used to visualize the categorical data. As usual, I will use it with medical data from NHANES. Ggalluvial is a great choice when visualizing more than two variables within the same plot.

    First let's load the libraries we need:

    library(tidyverse)
    library(RNHANES)
    library(ggalluvial)
    library(ggsci)
    

    I used the NHANES data from 2009-2010 to see how the diabetes mellitus lies among the overall population in the US. Below, I did data cleaning and wrangling.

    dat = nhanes_load_data("DEMO_F", "2009-2010") %>%
      select(SEQN, RIAGENDR, RIDRETH1) %>%
      left_join(nhanes_load_data("DIQ_F", "2009-2010"), by="SEQN") %>%
      select(SEQN, RIAGENDR, RIDRETH1, DIQ010) %>% 
      left_join(nhanes_load_data("BMX_F", "2009-2010"), by="SEQN") %>% 
      select(SEQN, RIAGENDR, RIDRETH1, DIQ010, BMXBMI) %>% 
      mutate(
        gender = recode_factor(RIAGENDR, 
                               `1` = "Males", 
                               `2` = "Females"),
         race = recode_factor(RIDRETH1, 
                             `1` = "Hispanic", 
                             `2` = "Hispanic", 
                             `3` = "White", 
                             `4` = "Black", 
                             `5` = "Others"), 
        diabetes = recode_factor(DIQ010,  
                               `1` = "Yes", 
                               `2` = "No"),
        BMI = if_else(BMXBMI >= 25, "Overweight", "Normal weight")) %>% 
      filter(!is.na(diabetes), race != "Others", !is.na(BMI))
    

    After having a final dataset 'dat,' I will 'group_by' variables of interest and get the frequency of the combined data. This information will be shown in y-axis of the plot.

    dt = dat %>% 
      group_by(race, gender, BMI, diabetes) %>% 
      summarise(N = n())
    

    Applying the new 'dt' created gives the diagram below:

    ggplot(data = dt,
           aes(axis1 = race, axis2 = gender, axis3 = diabetes,
               y = N)) +
      scale_x_discrete(limits = c("race", "gender", "diabetes"), expand = c(.1, .05)) +
      geom_alluvium(aes(fill = BMI)) +
      geom_stratum() + geom_text(stat = "stratum", label.strata = TRUE) +
      theme_minimal() +
      scale_fill_jama() +
      theme(legend.position="bottom") +
      labs( y = "No. individuals", title = "Diabetes in overall population in US 2009-2010",
              subtitle = "stratified by race, gender and diabetes mellitus", caption = "datascienceplus.com")
    

    This diagram shows that about 50% of people with diabetes are females, and as expected, most of them are overweight. The contribution of the race to the prevalence of diabetes is equal, so no major race differences are found.

    Feel free to comment/suggest.

    Related Post

    Linear Regression with Healthcare Data for Beginners in R

    $
    0
    0

    Category

    Tags

    In this post I will show how to build a linear regression model. As an example, for this post, I will evaluate the association between vitamin D and calcium in the blood, given that the variable of interest (i.e., calcium levels) is continuous and the linear regression analysis must be used. I will also construct multivariable-adjusted models to account for confounders.

    Let's start loading the packages:

    library(tidyverse)
    library(RNHANES)
    library(ggplot2)
    

    Variables selected for this analysis include age, sex, plasma levels of vitamin D, and plasma levels of calcium. All variables are assessed from NHANES 2007 to 2010 wave.

    d07 = nhanes_load_data("DEMO_E", "2007-2008") %>%
      select(SEQN, cycle, RIAGENDR, RIDAGEYR) %>%
      transmute(SEQN=SEQN, wave=cycle, RIAGENDR, RIDAGEYR) %>% 
      left_join(nhanes_load_data("VID_E", "2007-2008"), by="SEQN") %>%
      select(SEQN, wave, RIAGENDR, RIDAGEYR, LBXVIDMS) %>% 
      transmute(SEQN, wave, RIAGENDR, RIDAGEYR, vitD=LBXVIDMS) %>% 
      left_join(nhanes_load_data("BIOPRO_E", "2007-2008"), by="SEQN") %>%
      select(SEQN, wave, RIAGENDR, RIDAGEYR, vitD, LBXSCA) %>% 
      transmute(SEQN, wave, RIAGENDR, RIDAGEYR, vitD, Calcium = LBXSCA)
    
    d09 = nhanes_load_data("DEMO_F", "2009-2010") %>%
      select(SEQN, cycle, RIAGENDR, RIDAGEYR) %>%
      transmute(SEQN=SEQN, wave=cycle, RIAGENDR, RIDAGEYR) %>% 
      left_join(nhanes_load_data("VID_F", "2009-2010"), by="SEQN") %>%
      select(SEQN, wave, RIAGENDR, RIDAGEYR, LBXVIDMS) %>% 
      transmute(SEQN, wave, RIAGENDR, RIDAGEYR, vitD=LBXVIDMS) %>% 
      left_join(nhanes_load_data("BIOPRO_F", "2009-2010"), by="SEQN") %>%
      select(SEQN, wave, RIAGENDR, RIDAGEYR, vitD,  LBXSCA) %>% 
      transmute(SEQN, wave, RIAGENDR, RIDAGEYR, vitD, Calcium = LBXSCA)
    
    dat = rbind(d07, d09)
    
    all = dat %>% 
      # exclude missings
      filter(!is.na(vitD), !is.na(Calcium)) %>% 
      mutate(Gender = recode_factor(RIAGENDR, 
                               `1` = "Males", 
                               `2` = "Females"))
    
    head(all)
    ##    SEQN      wave RIAGENDR RIDAGEYR vitD Calcium  Gender
    ## 1 41475 2007-2008        2       62 58.8     9.5 Females
    ## 2 41477 2007-2008        1       71 81.8    10.0   Males
    ## 3 41479 2007-2008        1       52 78.4     9.0   Males
    ## 4 41482 2007-2008        1       64 61.9     9.1   Males
    ## 5 41483 2007-2008        1       66 53.3     8.9   Males
    ## 6 41485 2007-2008        2       30 39.1     9.3 Females
    

    The dataset is complete. Before running the regression analysis, the linear model, I will check the assumption, that the distribution of the dependent variable (levels of calcium) is normal.

    Distribution of calcium level:

    ggplot(data = all) + 
      geom_histogram(aes(Calcium), binwidth = 0.2)
    

    It is a normal distribution.

    Note: If the distribution is not normal, the dependant variable should be log transform by using log(Calcium).

    The model

    I will use the function lm() to create a linear regression model. In the first model I will not adjust for confunders, insted, I will do a univariate model.

    fit1 <- lm(Calcium ~ vitD, data = all)
    

    Now, I will plot the distribution of residuals to check for normality.

    hist(residuals(fit1))
    

    It is normally distributed.

    To see the results, estimates, pvalues etc use summary function.

    summary(fit1)
    ## 
    ## Call:
    ## lm(formula = Calcium ~ vitD, data = all)
    ## 
    ## Residuals:
    ##      Min       1Q   Median       3Q      Max 
    ## -2.51254 -0.23398 -0.00581  0.22943  2.64876 
    ## 
    ## Coefficients:
    ##              Estimate Std. Error t value Pr(>|t|)    
    ## (Intercept) 9.3517792  0.0087769 1065.50   <2e-16 ***
    ## vitD        0.0016522  0.0001315   12.56   <2e-16 ***
    ## ---
    ## Signif. codes:  0 '***' 0.001 '**' 0.01 '*' 0.05 '.' 0.1 ' ' 1
    ## 
    ## Residual standard error: 0.3683 on 12389 degrees of freedom
    ## Multiple R-squared:  0.01258,    Adjusted R-squared:  0.0125 
    ## F-statistic: 157.8 on 1 and 12389 DF,  p-value: < 2.2e-16
    

    The 95% confidence interval:

    confint(fit1)
    ##                   2.5 %      97.5 %
    ## (Intercept) 9.334575125 9.368983370
    ## vitD        0.001394404 0.001910026
    

    Intepretation

    From the results, I find that vitamin D is associated with calcium in the blood because the p-value is less than 0.05. Next, I see the direction of the association. The positive beta estimate (\(\beta\) = 0.0016) indicate that with increasing vitamin D in the blood, the levels of calcium also increases.

    To visualize this association I will use the ggplot and the function geom_smooth. See below:

    ggplot(all, aes(x = vitD, y = Calcium)) +
                geom_point() +
                geom_smooth(method="lm")
    

    The plot shows an increase of the levels of Calcium with the increase of vitamin D in the blood.

    Multivariable adjusted models

    Often, a significant association could be explained by confounders. According to Wikipedia, a confounder is a variable that influences both the dependent variable and independent variable, causing a spurious association. Therefore, it is important to adjust for major confounders such as age and gender. The levels of vitamin D in the blood are dependent to age because older adults have lower vitamin D in blood compared to young adults.

    To conduct a multivariable-adjusted model I add other variables to the model, in this example, I will add age and gender.

    fit2 <- lm(Calcium ~ vitD + Gender + RIDAGEYR, data = all)
    summary(fit2)
    ## 
    ## Call:
    ## lm(formula = Calcium ~ vitD + Gender + RIDAGEYR, data = all)
    ## 
    ## Residuals:
    ##      Min       1Q   Median       3Q      Max 
    ## -2.50114 -0.22824 -0.00857  0.22354  2.69352 
    ## 
    ## Coefficients:
    ##                 Estimate Std. Error t value Pr(>|t|)    
    ## (Intercept)    9.4686333  0.0109933 861.307   <2e-16 ***
    ## vitD           0.0019034  0.0001310  14.526   <2e-16 ***
    ## GenderFemales -0.0653111  0.0065383  -9.989   <2e-16 ***
    ## RIDAGEYR      -0.0022455  0.0001581 -14.204   <2e-16 ***
    ## ---
    ## Signif. codes:  0 '***' 0.001 '**' 0.01 '*' 0.05 '.' 0.1 ' ' 1
    ## 
    ## Residual standard error: 0.3639 on 12387 degrees of freedom
    ## Multiple R-squared:  0.03619,    Adjusted R-squared:  0.03596 
    ## F-statistic: 155.1 on 3 and 12387 DF,  p-value: < 2.2e-16
    

    The association between vitamin D and calcium remained significant after adjustment, suggesting that the association is independent (e.g., not explained) by age and gender.

    Stratifing analysis

    To evaluate the association separately in men and women is necessary to conduct a stratified analysis. For this, I need to separate men and women into two different datasets and run linear regression for each group.

    allfem = all %>% 
      filter(Gender == "Females")
    allmal = all %>% 
      filter(Gender == "Males")
    

    Linear regression in women and men

    fitfem <- lm(Calcium ~ vitD + RIDAGEYR, data = allfem)
    summary(fitfem)
    ## 
    ## Call:
    ## lm(formula = Calcium ~ vitD + RIDAGEYR, data = allfem)
    ## 
    ## Residuals:
    ##      Min       1Q   Median       3Q      Max 
    ## -2.03557 -0.24115 -0.01084  0.22396  2.61555 
    ## 
    ## Coefficients:
    ##              Estimate Std. Error t value Pr(>|t|)    
    ## (Intercept) 9.2764092  0.0145412 637.940   <2e-16 ***
    ## vitD        0.0019577  0.0001729  11.321   <2e-16 ***
    ## RIDAGEYR    0.0005348  0.0002307   2.318   0.0205 *  
    ## ---
    ## Signif. codes:  0 '***' 0.001 '**' 0.01 '*' 0.05 '.' 0.1 ' ' 1
    ## 
    ## Residual standard error: 0.3727 on 6254 degrees of freedom
    ## Multiple R-squared:  0.02247,    Adjusted R-squared:  0.02216 
    ## F-statistic: 71.89 on 2 and 6254 DF,  p-value: < 2.2e-16
    
    fitmal <- lm(Calcium ~ vitD + RIDAGEYR, data = allmal)
    summary(fitmal)
    ## 
    ## Call:
    ## lm(formula = Calcium ~ vitD + RIDAGEYR, data = allmal)
    ## 
    ## Residuals:
    ##      Min       1Q   Median       3Q      Max 
    ## -2.42787 -0.21555 -0.00506  0.21384  2.70896 
    ## 
    ## Coefficients:
    ##               Estimate Std. Error t value Pr(>|t|)    
    ## (Intercept)  9.6027158  0.0150801  636.78   <2e-16 ***
    ## vitD         0.0016591  0.0001973    8.41   <2e-16 ***
    ## RIDAGEYR    -0.0049452  0.0002105  -23.49   <2e-16 ***
    ## ---
    ## Signif. codes:  0 '***' 0.001 '**' 0.01 '*' 0.05 '.' 0.1 ' ' 1
    ## 
    ## Residual standard error: 0.3451 on 6131 degrees of freedom
    ## Multiple R-squared:  0.08713,    Adjusted R-squared:  0.08684 
    ## F-statistic: 292.6 on 2 and 6131 DF,  p-value: < 2.2e-16
    

    The interpretation of results should be as above.

    Thats all.

    Related Post

    Viewing all 47 articles
    Browse latest View live